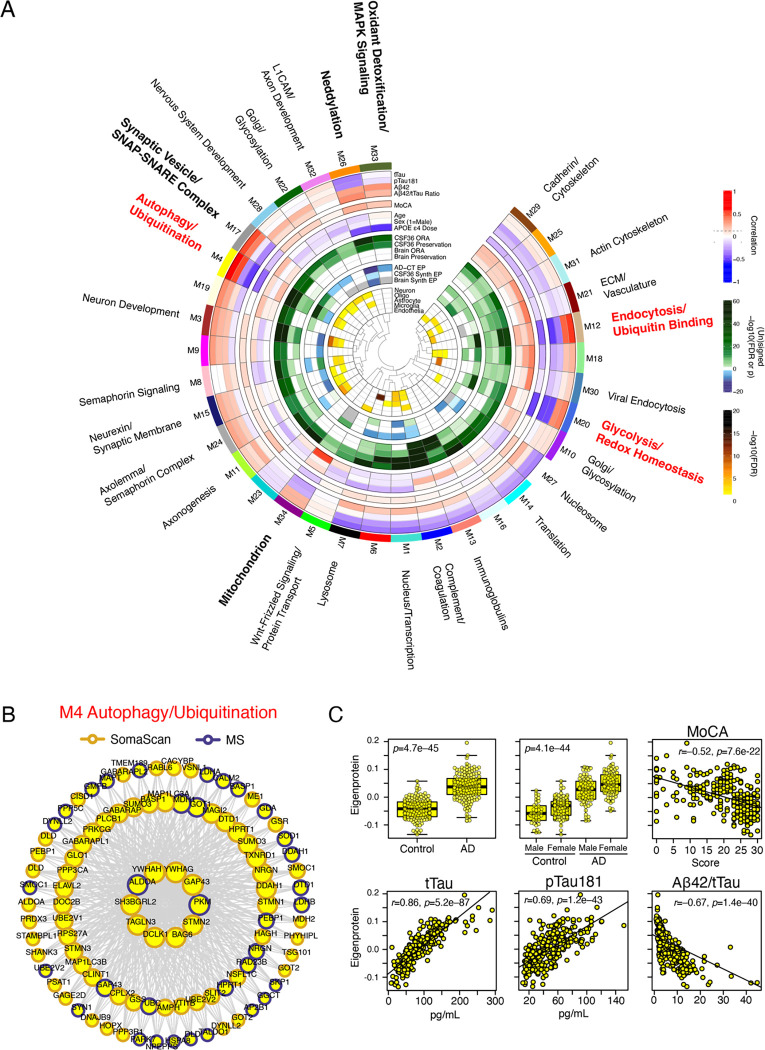
Figure 3. Multi-Platform AD CSF Protein Co-Expression Network.
(A) A protein co-expression network of 5242 protein assays from SomaScan and TMT-MS platforms measured across 296 individuals after outlier removal identified 34 co-expression modules capturing different biological processes (outer ring). The module eigenprotein, or first principal component of module expression, was correlated with AD endophenotypes including CSF levels of total tau (tTau), tau phosphorylated at residue 181 (pTau181), amyloid-β 1–42 levels (Aβ1–42), tTau/Aβ1–42 ratio, and Montreal Cognitive Assessment (MoCA, higher scores reflect better cognitive function). Module eigenproteins were also correlated with age, sex, and number of APOE ε4 alleles (APOE ε4 dose). Correlations were considered significant at an absolute value of approximately r=0.1 (p=0.05, dashed lines in legend). Modules were tested for preservation in a previous CSF network generated on 36 individuals(10) (CSF36) by overrepresentation analysis (ORA) and network preservation statistics (preservation), as well as an AD brain network(2) (brain ORA, brain preservation). Green shading indicates preservation at varying degrees of significance. Module eigenproteins were tested for significant change in AD (AD-CT EP), significant change in AD in the CSF36 network (CSF36 synth EP), and significant change in AD in the brain network (brain synth EP). Color shading indicates direction and level of significance (blue=decreased in AD, green=increased in AD, gray=not calculated). Modules were also tested for overlap of protein membership with brain cell type specific protein markers for neurons, oligodendrocytes (oligo), astrocytes, microglia, and endothelia. Color shading indicates degree of significant overlap. L1CAM, neuronal cell adhesion molecule L1; ECM, extracellular matrix. (B) The top 100 proteins by intramodule correlation for the M4 Autophagy/Ubiquitination module. Larger circles represent stronger correlation, with the largest circles representing module “hub” proteins. Proteins are outlined by the proteomic platform by which they were measured. (C) M4 module eigenprotein levels in AD compared to controls, and correlation with AD endophenotypes. Correlations were performed with bicor. Differences between groups were assessed by t test or one-way ANOVA. For overlap and preservation tests, see Methods.

