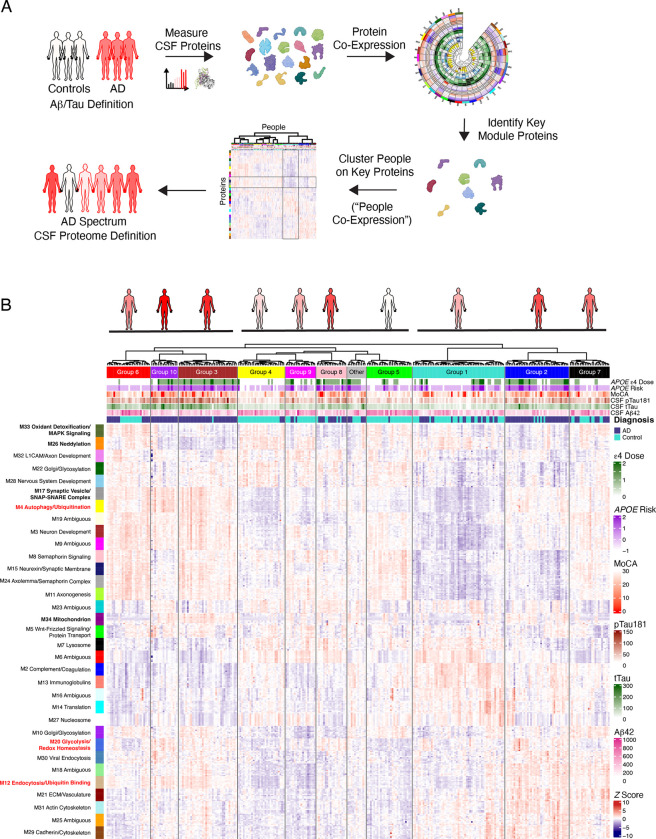
Figure 7. Grouping Individuals Based on CSF AD Proteome Network Features.
(A) Scheme for defining groups of people based on their proteomes. CSF protein levels were measured by SomaScan and TMT-MS and used to construct a protein co-expression network. The top ten hub proteins from each module were then used to cluster individuals using the same hierarchical clustering algorithm used to construct the protein co-expression network, defining groups of people based on similarity across CSF network hub proteins. (B) z scored relative protein abundance heatmap of the top ten hub proteins in each CSF network module, with individuals (n=296) grouped into ten clusters based on the similarity across hub proteins. Figures at the top represent each group, with underlines highlighting the three superclusters. Individuals are shaded based on the number of AD cases within the group as defined by CSF Aβ and tau levels. In addition to diagnostic category, measures of APOE ε4 allele number (ε4 Dose; 0, 1, or 2), APOE risk (−1, ε2/3; 0, ε3/3, 1, ε3/4; 2, ε4/4), Montreal Cognitive Assessment (MoCA, higher scores indicate better cognitive function), CSF pTau181, CSF tTau, and CSF Aβ1–42 are provided for each participant.

