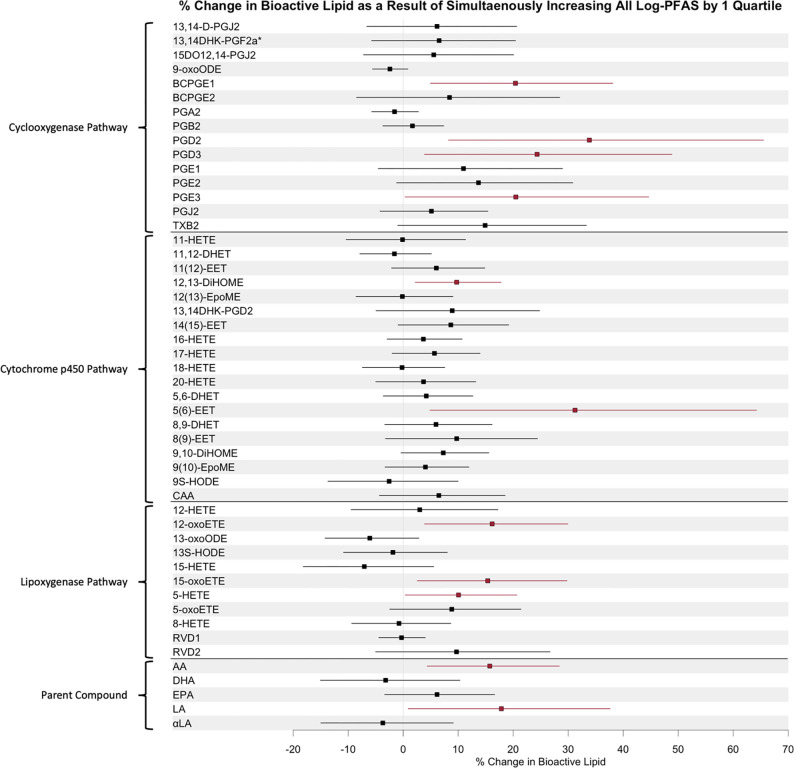
Figure 4.
Forest Plot of Quantile g-computation Effect Estimates in the Combined Cohort Analysis with IKIDS and CIOB Cohorts (N=343), showing of β Estimates Corresponding to Percentage Change in Bioactive Lipids as a Result of Simultaneous 1-Quartile Increase in All Log-Transformed PFAS. Model adjusted for Maternal Age, Maternal Education, Pre-Pregnancy BMI, Parity, Gestational Age at Visit, and Cohort.

