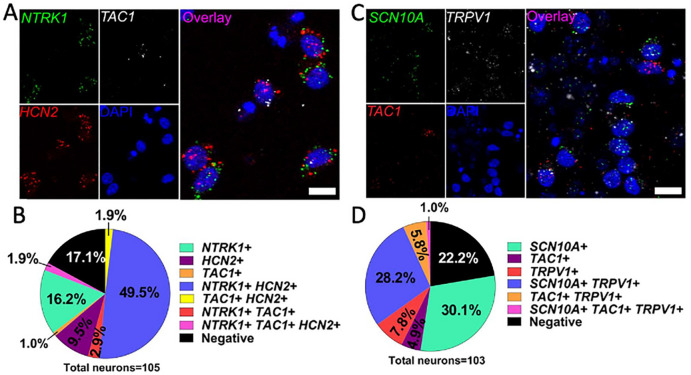
Figure 6. Gene expression in Anatomic RealDRG™ neurons.
A. Expression of mRNA for NTRK1 (TRKA, green), TAC1 (preprotachykinin-1; white) and HCN2 (red) seen in Anatomic protocol cells at DIV14 co-labeled with DNA marker DAPI (blue). B. Pie chart for staining in A showing distributions of cells expressing indicated markers. C. Expression of mRNA for SCN10A (NaV 1.8, green), TRPV1 (white), TAC1 (red) seen in Anatomic protocol cells at DIV16 co-labeled with DNA marker DAPI (blue). D. Pie chart for staining in C showing distributions of cells expressing indicated markers. Images are cropped from 40X images. Scale = 10 μm.

