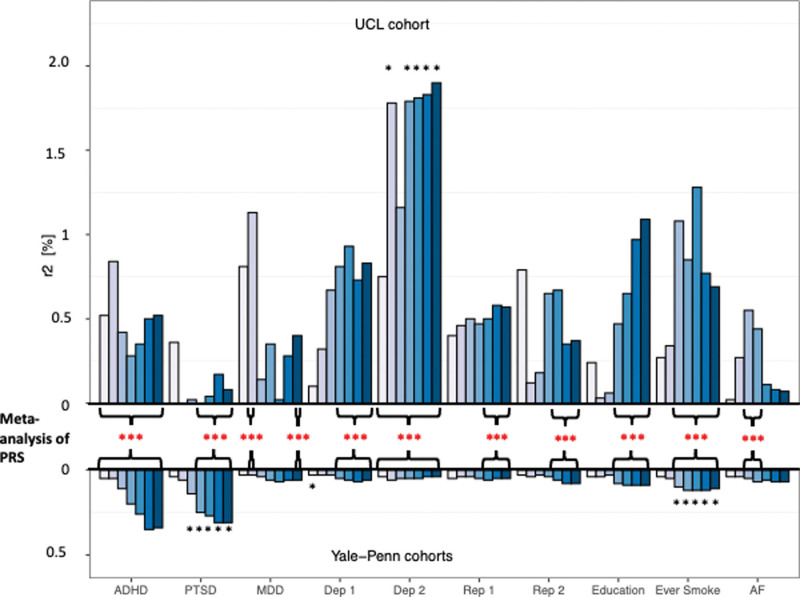
Fig. 3.
PRS analysis in the UCL and Yale-Penn ASPD samples. PRS results are shown at different P-value thresholds for each trait along with the percentage of variance explained by the PRS (Nagelkerke’s R2) for ten traits in the UCL and Yale-Penn cohorts. *Comparisons significant after FDR correction in the individual PRS analyses (black *) or in the PRS meta-analysis (red*). ADHD, attention deficit hyperactivity disorder; AF, alcohol frequency; Dep 1, depressive symptoms; Dep 2, seen doctor for nerves, anxiety, tension or depression; Education, age completed full-time education; Ever Smoke, Whether a participant had ever smoked a cigarette; MDD, major depression disorder; PTSD, post-traumatic stress disorder; Rep 1, age at first live birth (female); Rep 2, age at first birth (male).

