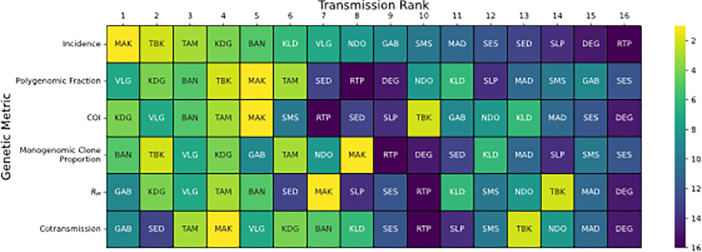
Figure 2.
Rank Analysis for each sample site based on the genetic metrics used in this study is shown. Transmission rank is defined as the rank one would use when using the metric to infer transmission intensity (Table 1), with 1 being the highest and 16 being the lowest. Assigned transmission ranks were assigned based on the average value calculated across sample years.
For polygenomic fraction (A), The REALMcCOI COI (B), and RH (C), the transmission rank is positively correlated with the metric. For cotransmission fraction (D) and monogenomic clone proportion (E), the transmission rank is negatively correlated with the metric. The solid black line between transmission rank 7 and 8 indicates the threshold used when grouping transmission ranks into a 2 × 2 contingency table.

