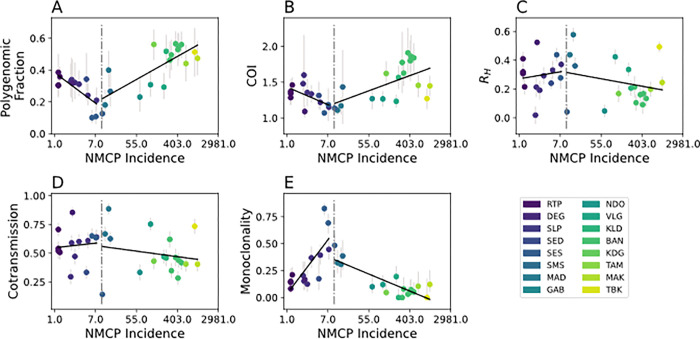
Figure 4.
Relationship between incidence and (A) polygenomic fraction, (B) THE REAL McCOIL COI, (C) RH, (D) cotransmission fraction, and (E) monogenomic clone proportion. Error bars represent the 95% confidence interval for each examined site-year. The black lines represent model ordinary least squares regression model fits. A vertical dotted line is drawn at an NMCP-reported incidence of 10 ‰.

