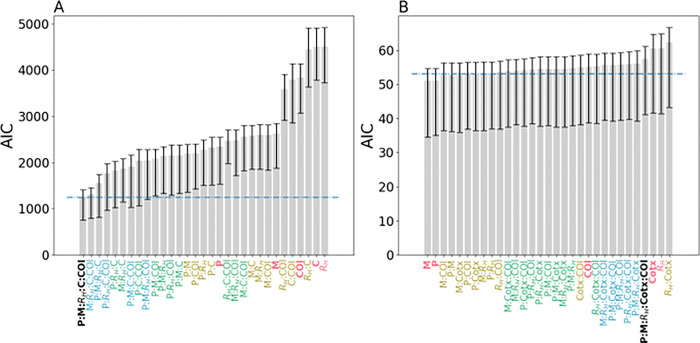
Figure 5.
AIC values for (A) GLMhigh and (B) GLMlow models calibrated with different combinations of genetic epidemiology metrics. P refers to polygenomic fraction, Cotx refers to cotransmission fraction, COI refers to THE REAL McCOIL COI, and M refers to monogenomic clone proportion. For convenience, models trained with all five genetic epidemiology metrics are labeled in black, four in blue, three in green, two in yellow, and one in red. Error bars indicate the 95% confidence interval obtained from leave-one-out cross-validation. The dotted blue line indicates the line of statistical significance relative to the best fitting model. Bars whose average is above the dotted line are statistically worse than the best-fitting model. Bars whose average is below the dotted line perform equally well as the best-fitting model.

