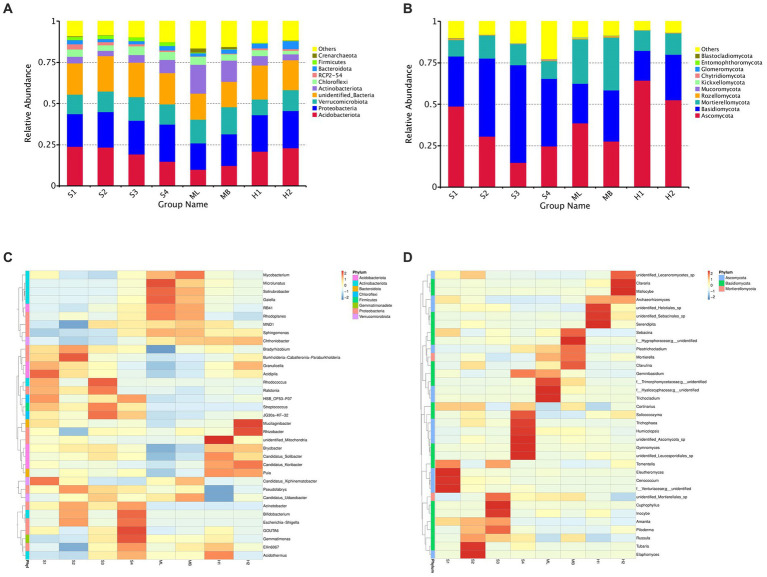
Figure 1.
Total bacterial and fungal abundance in birch secondary forest due to different types of interference of in the Greater Khingan Mountains in China. (A) Relative abundance of bacteria (16S rRNA gene copy numbers) at the family taxonomic level. (B) Relative abundance of fungi (ITS copy numbers) at the family taxonomic level. Relative abundance of bacteria (C,D) fungi in birch secondary forest due to different types of interference. Names of bacteria and fungi are shown in different colors, others represent the sum of the relative abundances of all bacteria or fungi other than those of shown in the diagram. The species annotation of bacteria (C) and fungi (D) are shown at the genus taxonomic level. The tree on the left is the species cluster tree; the value corresponding to the heat map is the Z-value obtained from the relative abundance of species in each row after standardized processing.

