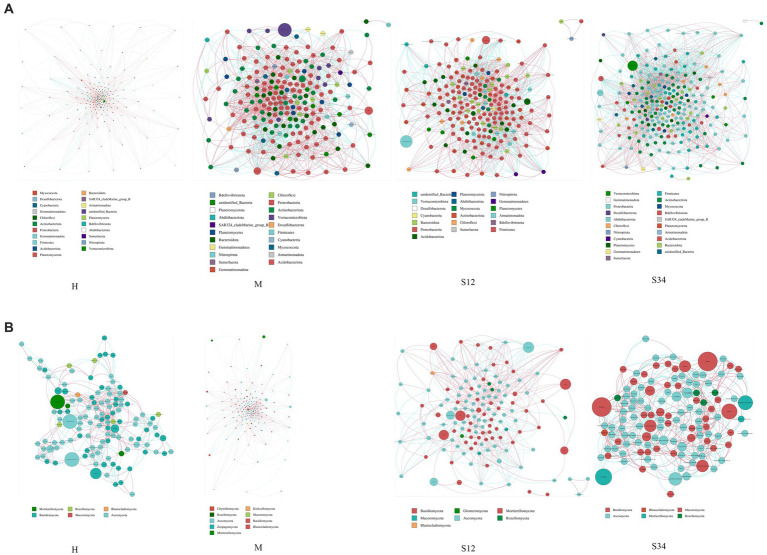
Figure 8.
Network analysis of correlations and model prediction. (A) Network analysis of correlations in bacteria. (B) Network analysis of correlations in fungi. Nodes of the same phylum have the same color (as shown in the legend). The correlation coefficients between the thickness of the lines between nodes and the interaction between species are positively correlated in absolute value, and the color of the lines indicates the correlation (red is positively correlated, blue is negatively correlated).

