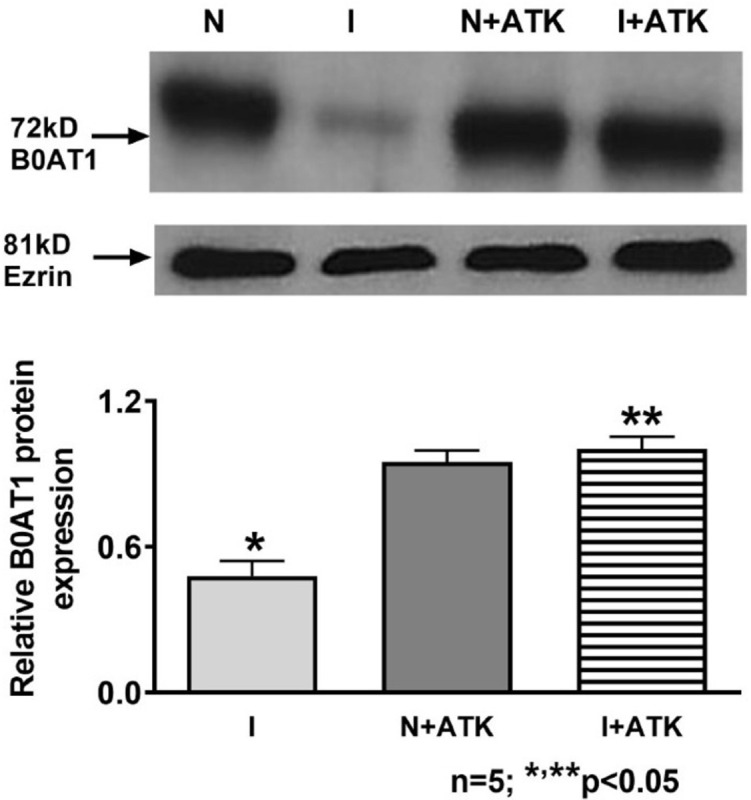
Fig 4. B0AT1 protein expression in AKT treated villus cell BBM.

A representative Western blot of BBM B0AT1 protein levels and its related ezrin are shown in the upper panel. The densitometric quantitation of the B0AT1 and ezrin bands were done with FluorChem SP software integrated with the Alpha Innotech FluorChemTM instrument. The Integrated Density values (IDV) obtained for each experiment were normalized by dividing the IDV value of B0AT1 by the IDV value of its related ezrin band. The values thus obtained for I, N+ATK, and I+ATK were then calculated as relative to N, which was set to 1. Student t-test analysis of data showed that inflamed (I) was significantly different (lower) from normal and inflamed treated with ATK was significantly different (higher) from inflamed.
