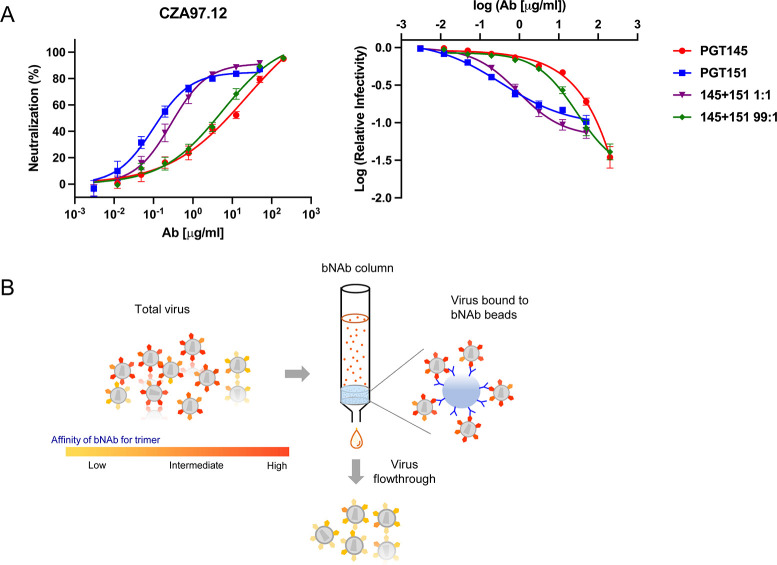
Fig 1. Neutralization and depletion of CZA97.012 PV.
A. Extent of neutralization of un-depleted PV (%) in a TZM-bl assay is plotted as a function of the concentration (μg/ml) of PGT145 or PGT151 or their combined total concentration at a mixture of 1 + 1 or 99 + 1 (left). The same results are plotted as the log of infectivity relative to absence of bNAb as a function of the log of bNAb concentration, a plot that better reveals small differences in efficacy and PF (right). The data points in both diagrams are means of 13 replicates ± s.e.m. B. The schematic shows preferential depletion of PV particles decorated with Env that binds with high affinity to bNAbs immobilized on Sepharose beads. The unbound virions were then tested in the TZM-bl-based neutralization assay against bNAbs and sera.

