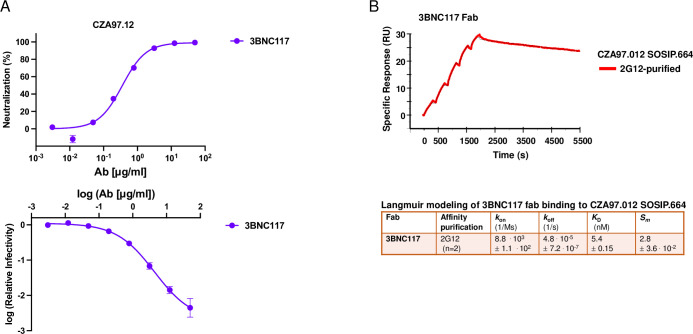
Fig 10. Analyses of neutralization and binding by 3BNC117.
A. Neutralization of CZA97.012 PV by 3BNC117 is shown. The diagram depicts a sigmoid curve fitted to % neutralization as a function of bNAb concentration (μg/ml) (top). The log10 of the infectivity after bNAb incubation relative to that for absence of bNAb is plotted on the y axis as a sigmoid function of the log10 of the bNAb concentration (μg/ml) on the x axis (bottom). The data points in both diagrams are means of two replicates ± s.e.m. B. SPR sensorgram for single-cycle kinetics of 3BNC117 Fab binding to 2G12- and SEC-purified CZA97.012 SOSIP.664 trimer. The sensorgram shows the cumulative binding at increasing concentrations to immobilized trimer in response units (RU), after background subtraction, on the y-axis vs. time (s) on the x-axis. The curve for the binding data is shown in color according to the label code; the curve for the fitted binding function is shown as a thin black line. Each association phase was 300 s; the dissociation at the end was monitored for 3600 s. The number of replicate titrations and the fitted and calculated binding parameters are given in the table underneath the sensorgram.

