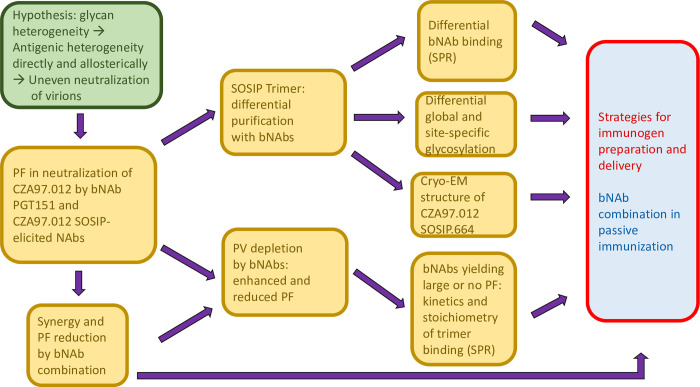
Fig 13. Flow chart from hypothesis to experiments and implications for the HIV-1 bNAb field.
The main hypothesis is presented in the green shape to the left. Experimental approaches and findings are listed in golden boxes with a progression from left to right. Wider implications for the HIV-1 bNAb field, i.e., active and passive immunization, are indicated in red and blue to the right.

