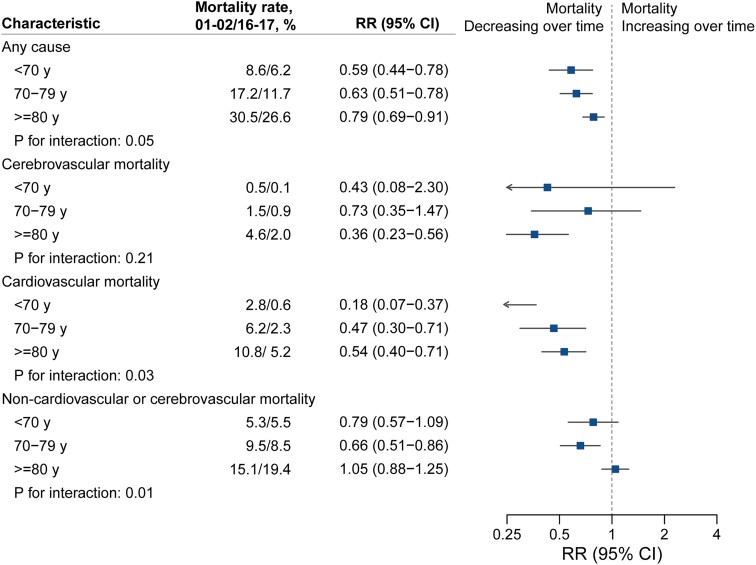
Figure 2.
Temporal trends in all-cause and cause-specific mortality rates at 1 year following diagnosis of atrial fibrillation by age group. Crude mortality rates by age groups alongside rate ratios, 95% confidence intervals, and interaction P-values from multivariable Poisson regression models accounting for year of diagnosis, age (as a continuous variable), sex, socio-economic status, region, and 18 baseline comorbidities. Interaction P-values refer to the interaction between age group (categorized as age < 70, age 70–79, or age ≥ 80 years) and year of diagnosis.

