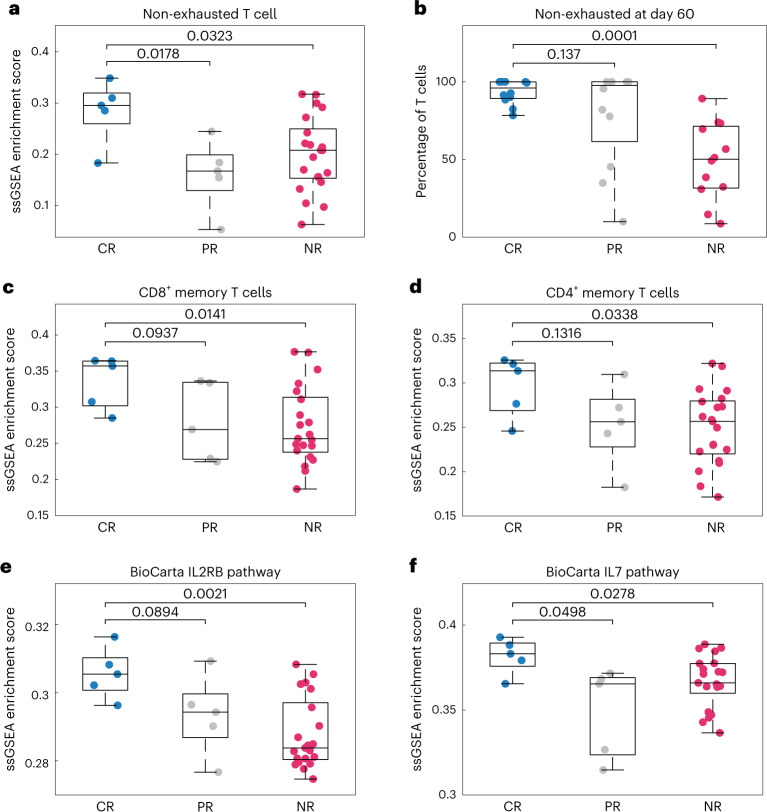
Fig. 2. ssGSEA estimates the activity of signaling pathways and enrichment of cell populations in CAR-Ts, separated by response.
a,c–f, ssGSEA reveals differences in cell populations and signaling pathways between populations for selected cell signatures and signaling pathways (panel titles). n = 31 independent samples—five CR, five PR and 21 NR. b, Using the 12 best-fitting parameter sets for each population and model simulations, we calculated the percentage of the T cell population at day 60 that is non-exhausted. The median non-exhausted T cell population at day 60 (over the 12 parameter sets) is near 100% for both CR and PR populations, whereas the median is approximately 50% for the NR population. Differences between populations were assessed using an unequal variances two-sided t-test (P values shown). Box plots represent median ± 25th percentiles, with whiskers representing min/max values.

