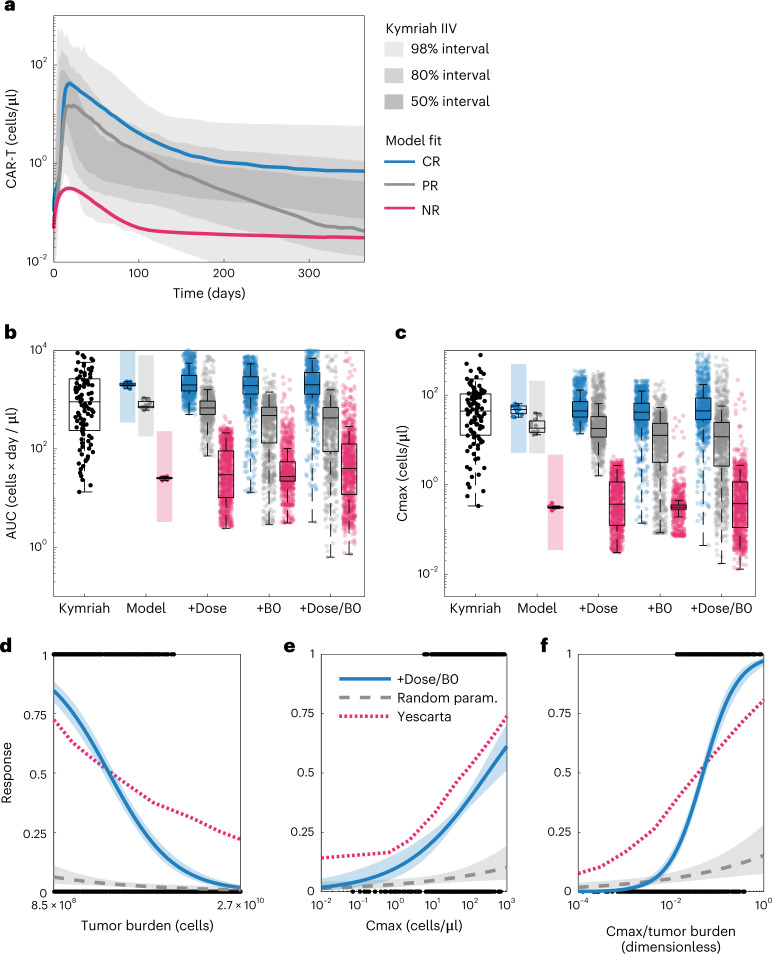
Fig. 5. Clinical variability in dose, tumor burden and CR/PR/NR pharmacological archetype account for population variance in Kymriah exposure and predict clinical covariates of response to Yescarta.
a, Shaded areas show the clinical variability of exposure to Kymriah5 with median model simulations overlaid for the CR, PR and NR populations. b, CAR-T AUC distributions. The box plot labeled Kymriah shows the distribution in AUC obtained from 1,000 simulations of the clinical pharmacokinetics model (each dot corresponds to a percentile of the AUC distribution). The group of box plots labeled Model shows the AUC distribution obtained for the 12 best-fitting parameter sets for each population (CR, blue; PR, gray; NR, pink) with the colored background the range of AUCs obtained from the clinical pharmacokinetics data. The group of box plots labeled +Dose shows the AUC distributions for each population when doses are randomized within reported ranges in the virtual population (n = 1,000); +B0 shows the distributions when initial tumor burdens are randomized; and +Dose/B0 shows the distribution when both dose and initial tumor burdens are randomized. Box plots represent median ±25th percentiles and whiskers the min/max value or an additional 1.5-fold quartile distance. c, Cmax distributions plotted as in a. d–f, We defined response to treatment as tumor AUC less than 10,000 cells × day / µl and evaluated whether each patient in the virtual CR population with randomized doses and tumor burdens (+Dose/B0) exhibited a response (black binary data points). Logistic regression with respect to the tumor burden (d), Cmax (e) or the quotient of Cmax and tumor burden (f) reveals how each predicts response (blue curve indicates model estimate with 95% confidence intervals). As a control, uniform random sampling of parameter space (1,000 parameter sets) does not exhibit these response relationships (gray dashed line indicates model estimate with 95% confidence intervals). The clinical covariates of response calculated using the virtual population have the same trends as published covariates of response to Yescarta (red dotted curves). Note that the covariates of response for Yescarta have been linearly scaled to match the ranges in the virtual population for plotting.

