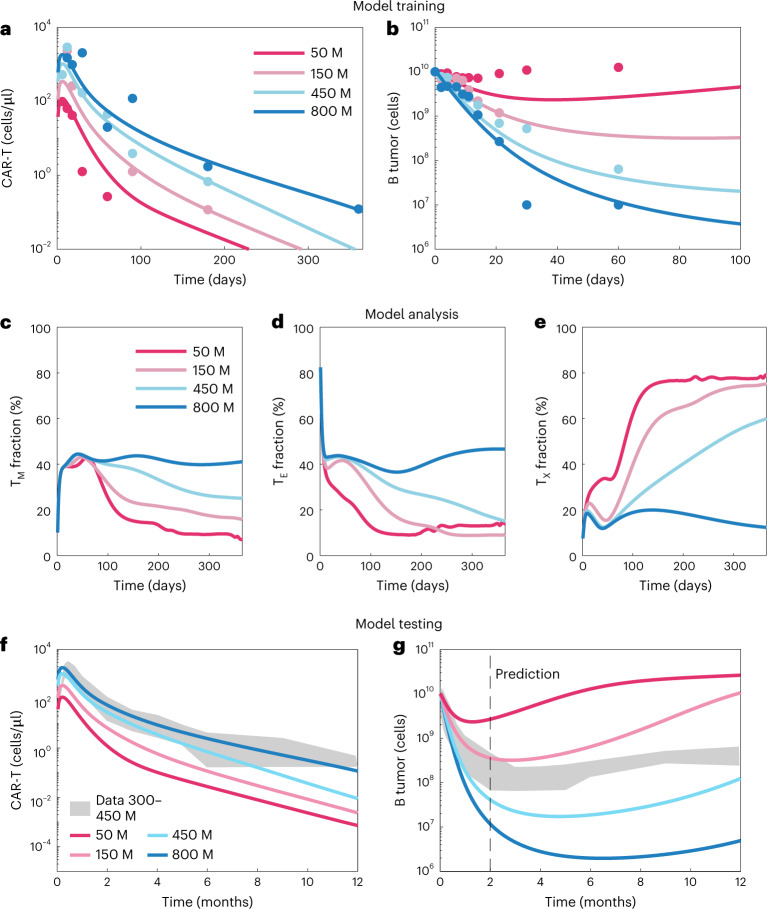
Fig. 6. Model extension to Abecma dose response.
a,b, Model training: we fit the toggle switch model to phase 1 dose–response data and observed good fits, with Pearson correlation coefficients from the goodness-of-fit plots (Supplementary Fig. 15) of 0.59 for the CAR-T cells and 0.74 for the tumor. c–e, Model analysis: we compared the fraction of the total T cell population across doses in the memory, effector and exhausted groups by plotting the mean across parameter sets. For low doses, the T cell population becomes mostly exhausted, whereas, for high doses, the population of memory and effector cells persists. f,g, Model testing: we compared predictive simulations at two doses with the data reported in the phase 2 study (150–450 million cell doses)40. The tumor dynamics out to 1 year fall within the bounds predicted for the 150–450 million cell doses. M, million.

