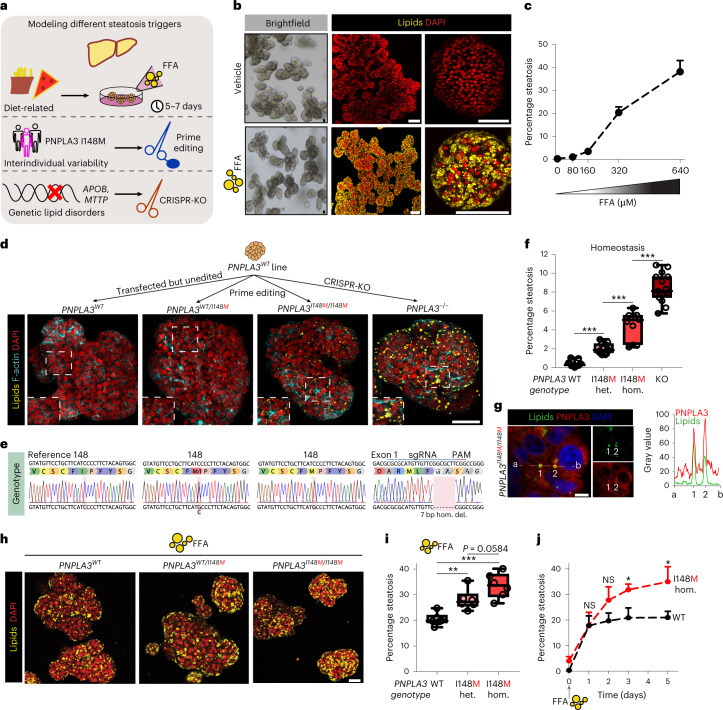
Fig. 1. Precision gene editing in human fetal hepatocyte organoids evaluates genetic predisposition to steatosis.
a, Strategy used to generate a panel of human hepatic steatosis organoid models. b, Brightfield images and Nile Red lipid staining of vehicle-treated and FFA-exposed (640 μM) WT organoids. c, Quantification of the percentage of steatosis after exposure to increasing FFA concentrations in WT organoids (mean ± s.d.). n = 6 independent replicates from two donors. d, Nile Red lipid staining overlaid with phalloidin of PNPLA3 variant organoids generated from the same donor. e, Sanger trace sequences of the PNPLA3 genotypes of PNPLA3 variant organoids. f, Quantification of the percentage of spontaneous steatosis in PNPLA3 variant organoids. n = 11 independent replicates for PNPLA3WT and PNPLA3WT/I148M, n = 10 independent replicates for PNPLA3I148M/I148M, n = 15 independent replicates for PNPLA3KO from either two (WT, WT/I148M, I148M/I148M) or three (KO) clonal lines from two donors. Two-tailed nested t-test: KO versus WT and I148M/I148M versus WT, ***P < 0.0001; I148M/I148M versus WT/I148M, ***P = 0.0001. g, Left, immunofluorescence staining for PNPLA3 and lipid droplet visualization with BioTracker 488 Green Lipid Droplet Dye in PNPLA3I148M/I148M organoids. Right, quantification of the fluorescence signal from a to b through lipid droplets (1 and 2). h, Nile Red lipid staining of FFA-exposed (320 μM) PNPLA3 variant organoids. i, Quantification of the percentage of steatosis following FFA exposure in PNPLA3 variant organoids. n = 6 independent replicates from two clonal lines from two donors per genotype. Two-tailed nested t-test: WT/148M versus WT, **P = 0.0026; I148M/I148M versus WT, ***P = 0.0002; I148M/I148M versus WT/148M, P = 0.0584. j, Quantification of the percentage of steatosis over time after FFA exposure (320 μM) in PNPLA3WT and PNPLA3I148M/I148M organoids generated from the same donor (mean ± s.d.). n = 3 independent replicates per genotype. Two-tailed t-test: day 3, *P = 0.0128; day 5, *P = 0.0191; NS, not significant. f,i, The box indicates the 25–75th percentiles, the center line indicates the median and the whiskers indicate minimum and maximum values. b,d,g,h, Representative of n = 10, 6, 3 and 6 independent experiments, respectively. Scale bars, 100 μm (b), 50 μm (d), 5 μm (g) and 25 μm (h). PAM, protospacer adjacent motif; hom., homozygous; het., heterozygous; del., deletion.

