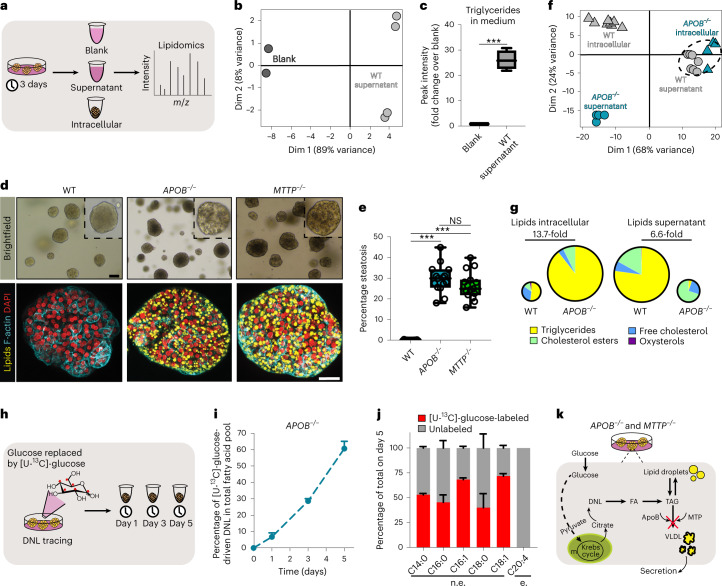
Fig. 2. Organoid models of DNL-generated lipid accumulation by introduction of APOB or MTTP mutations.
a, Workflow used to perform lipidomics on organoid cultures. b, PCA on neutral lipids found in the supernatant of WT organoids and in blank medium. n = 4 independent measurements in WT organoid cultures from two donors; n = 2 independent measurements for blank medium. c, Quantification of TAG content in the supernatant of WT organoids relative to blank medium. Sample sizes as in b. Two-tailed t-test: ***P = 0.0008. d, Brightfield images and Nile Red lipid staining overlaid with phalloidin of WT, APOB−/− and MTTP−/− organoids. Representative of n = 9 independent experiments. e, Quantification of the percentage of spontaneous steatosis in WT, APOB−/− and MTTP−/− organoids. n = 15 independent replicates from three clonal lines per genotype from three donors. Two-tailed nested t-test: APOB−/− versus WT, ***P < 0.0001; MTTP−/− versus WT, ***P = 0.0002. f, PCA of neutral lipids found intracellularly and in the supernatant of APOB−/− and WT organoids. n = 4 independent measurements in APOB−/− organoid cultures from two donors; n = 8 independent measurements in WT organoid cultures from the same two donors. g, Pie charts indicating the average distribution of different neutral lipid species in WT and APOB−/− organoids. Pie size reflects average FC in total lipid amount. Sample sizes as in f (see also Supplementary Fig. 6c). h, Workflow used to perform DNL tracing using [U-13C]-glucose in APOB−/− organoids. i, Quantification of the percentage of glucose-driven DNL contribution to the fatty acid pool in APOB−/− organoids (mean ± s.d.). n = 2 independent quantifications in APOB−/− organoid cultures from two donors. j, Quantification of the percentage of glucose-driven DNL contribution for five nonessential (n.e.) fatty acids in APOB−/− organoids 5 days post tracing (mean ± s.d.). No labeling is observed for the essential (e.) fatty acid C20:4. Sample size as in i. k, Mechanism of lipid accumulation in APOB−/− and MTTP−/− organoids. c,e, The box indicates the 25–75th percentiles, the center line indicates the median and the whiskers indicate minimum and maximum values. d, Scale bars, 100 μm (brightfield) and 25 μm (fluorescence). Dim, dimension.

