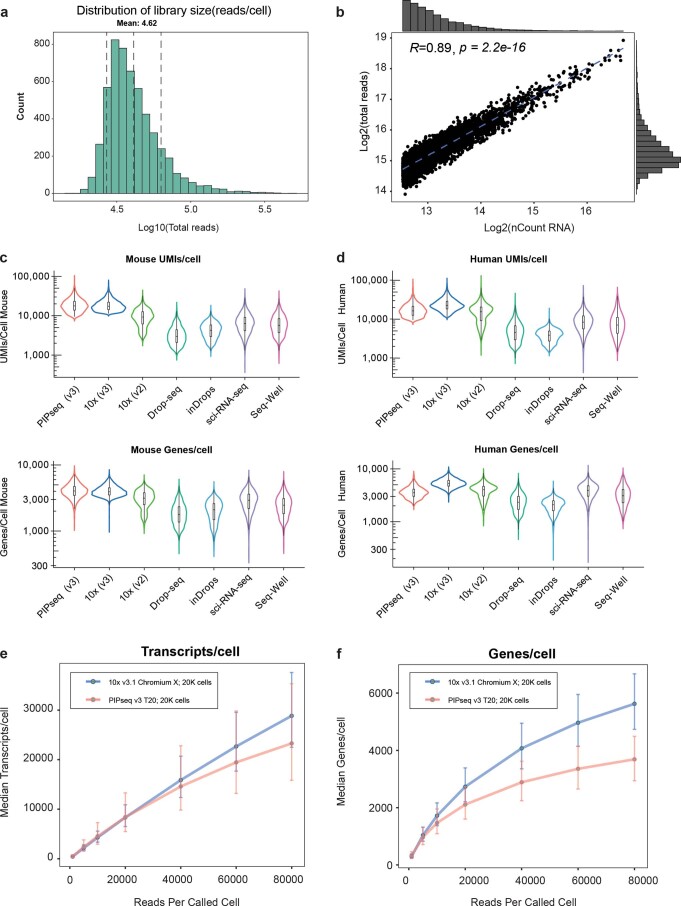
Extended Data Fig. 5. Data quality assessment of PIP-seq.
(a) Representative distribution of reads per cell. (b) Correlation between reads and genes per cell. Spearman’s R and p values were calculated in R v4.1.0. (c,d) Comparison of UMIs/cell and genes/cell in current single-cell methods. Plots display a violin for a single representative sample for each platform. Transcripts per cell and genes per cell are separated by cell species (mouse (c) and human (d)), identified using the 85% species thresholding technique, as described in the methods. Box plots show the median, 25th and 75th percentiles. (e,f) Comparison of PIP-seq to 10X Genomics across a range of sequencing depths (0-80,000 reads/cell) (e) UMIs/cell and (f) genes/cell 80k cells down sampled from one biological replicate. Points represent the median with the lower and upper error bars corresponding to the 25th and 75th percentiles, respectively.

