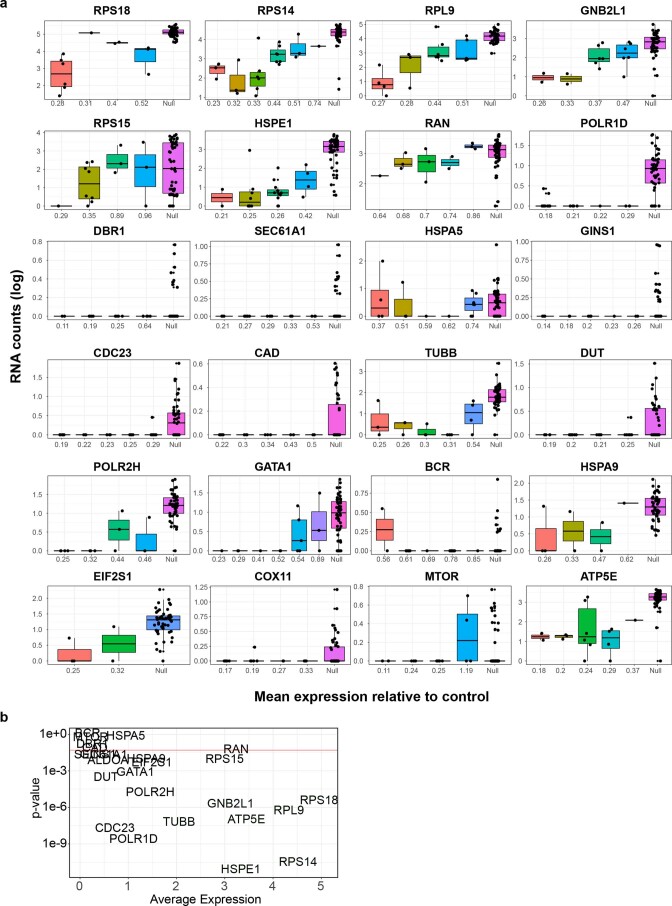
Extended Data Fig. 7. CROP-seq with PIP-seq.
(a) Gene expression for each sgRNA within an allelic series for all genes in the CRISPRi library. Each sgRNA is ordered from predicted high to low knockdown efficiency. Non-targeting sgRNA are denoted as “Null.” Data is from one CROP-seq experiment. Box plots indicate the median with the lower and upper hinges corresponding to the 25th and 75th percentiles. Raw data points are displayed with a slight jitter. (b) The relationship between gene expression and predicted knockdown of each gene. Expected changes in transcription across the allelic series were prominent in highly expressed genes. p-value represents the significance of the generalized additive model relating gRNA identity to knockdown efficiency for each gene. P-values for each model were directly plotted along with the average expression for each gene (using log1p of the normalized counts). The horizontal red line shows the significance level of p = 0.05.

