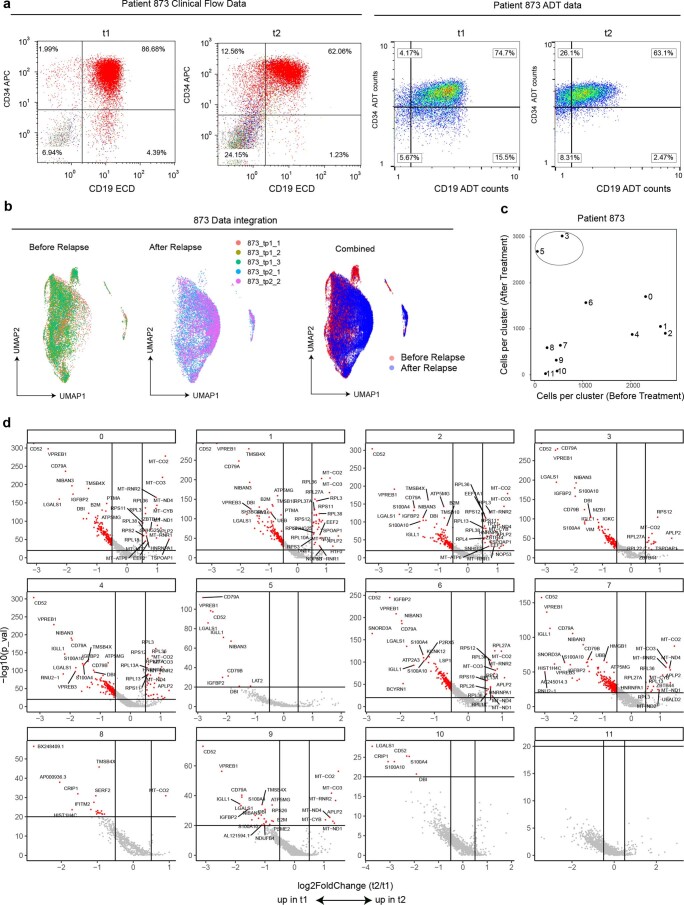
Extended Data Fig. 10. Analysis of PIP-seq data from MPAL Patient 873.
(a) Clinical flow cytometry and corresponding antibody derived tag (ADT) data for patient 873 with mixed phenotypical acute leukemia (MPAL). (b) Integration of replicates and time points. (c) Correlation between the number of cells in each cluster before and after treatment identifies the expansion of clusters 3 and 5. (d) Volcano plots showing differential gene expression, by cluster, between t1 (before treatment) and t2 (after relapse).

