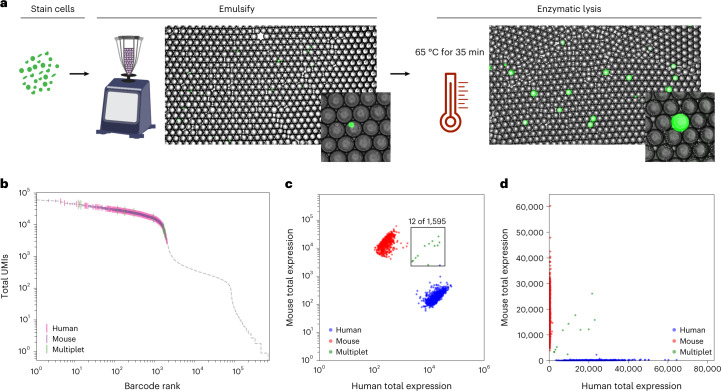
Fig. 2. Heat-activated enzymatic lysis yields high-purity single-cell transcriptomes.
a, Fluorescence microscopy (brightfield and green fluorescent protein) of calcein-stained cells emulsified with barcoded bead templates before and after heat-activated lysis. Inset images show cell puncta (left) and release of calcein (right) after lysis. Representative images are shown from experiments completed at least three times. b–d, Cell purity assessed with mouse–human mixing studies. b, Distribution of total UMIs as a function of cell barcode rank. The gray line represents all barcode groups, with called cells colored by species. c,d, Purity analysis of cell transcriptomes assessed using barnyard plots. Cells are colored by cell type (red, mouse reads; blue, human reads; green, mixed reads). Representative data are shown from species-mixing experiments completed over ten times.

