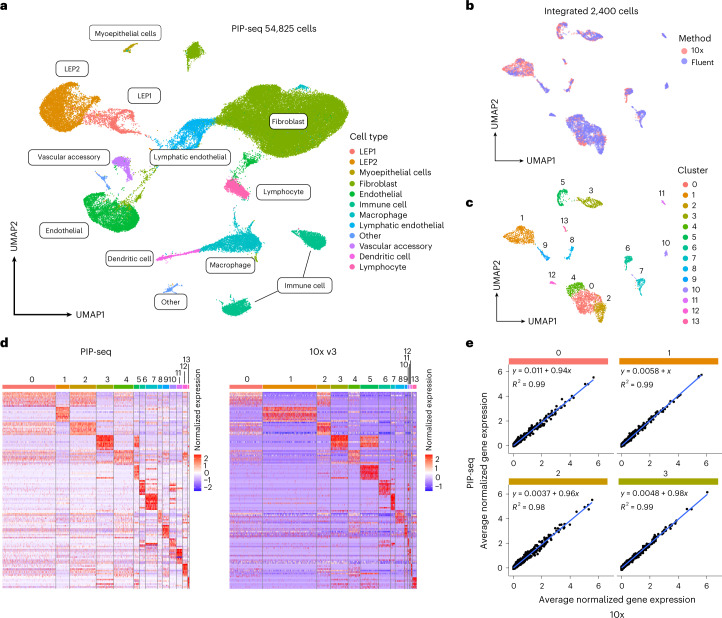
Fig. 3. Accurate single-cell transcriptional profiling of healthy breast tissue using PIP-seq.
a, Clustering and identification of cell types from PIP-seq data (54,825 cells from two individuals). b–e, Comparison of PIP-seq data to 10x Genomics data collected from the same tissue. b, Integration of PIP-seq and 10x data. c,d, Cell clustering and comparison of marker genes between platforms. d, Heat maps of marker gene expression show similar patterns in PIP-seq and 10x data. e, Correlations in normalized gene expression, by cluster, between platforms (see also Extended Data Fig. 4a).

