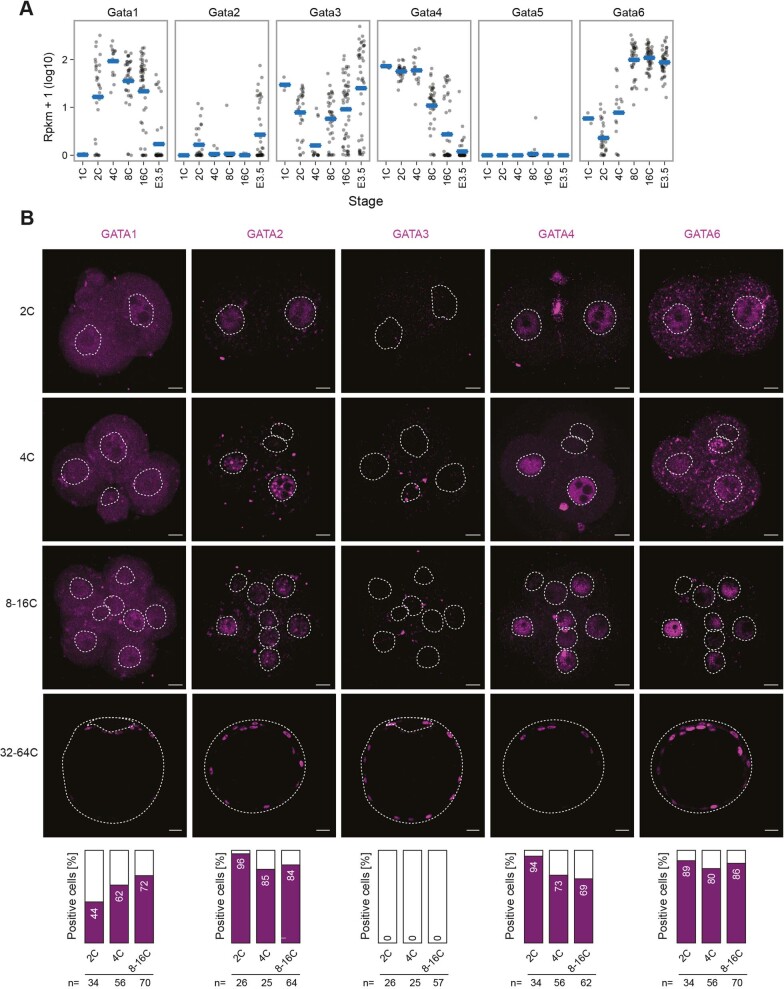
Extended Data Fig. 6. Multiple GATA TFs are expressed during mouse preimplantation development.
(a) Expression of GATA TFs assessed by scRNA-seq across different stages of early mouse development42. Horizontal dashes indicate the mean of 24 (1C), 180 (2C), 84 (4C), 222 (8C), 300 (16C) and 258 (E3.5) cells. (b) Protein staining of all GATA TFs except GATA5 in preimplantation mouse embryos (stages indicated). Nuclei were detected by DAPI staining and their contour is marked (dashed line). Bar plots show the percentages of positive nuclei for the respective GATA protein. Percentages represent the mean of two biological replicates. The number of nuclei counted is shown below the plots. Scale bars represent 10 μm, scale bars for 32-64 C are 20 μm. Source numerical data are available in source data.

