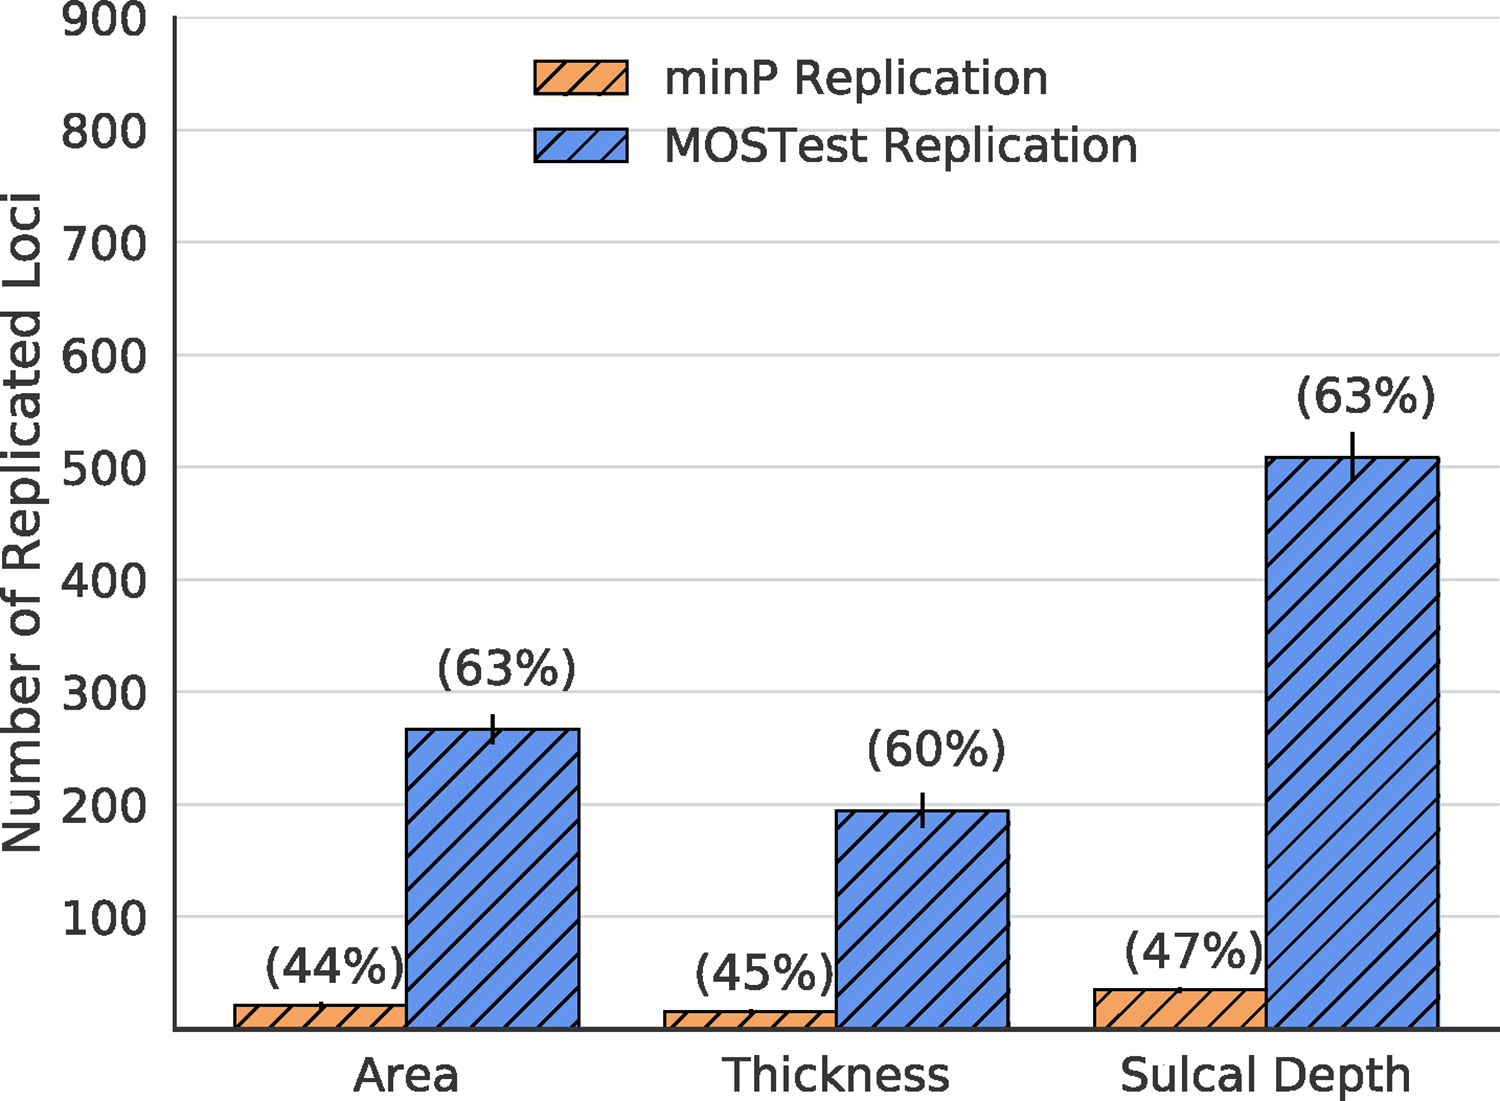
Figure 4.

Replication yield within the ABCD dataset across 10 training folds of UK Biobank for cortical morphometry measures. Bars represent the number of loci that replicate in ABCD at a nominal significance level (p<0.05). Error bars are standard deviations across 10 training sets of UK Biobank. Numbers in parentheses represent replication rate (# of discovered loci / # replicated loci). ABCD: Adolescent Brain Cognitive Development Study.
