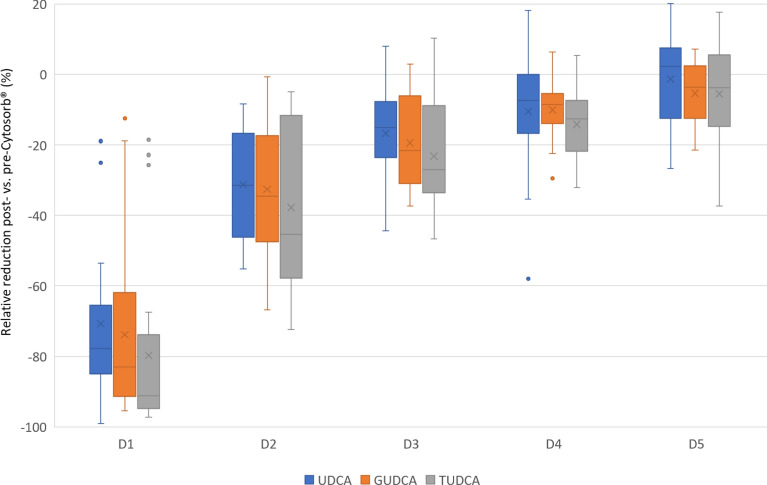
Fig. 2.
Relative reduction (%) of protective bile acids with Cytosorb®. D1: 10 min after initiation of Cytosorb®, D2: 1 h after initiation of Cytosorb®, D3: 3 h after initiation of Cytosorb®, D4: 6 h after initiation of Cytosorb®, D5: 12 h after initiation of Cytosorb®, blue boxplots represent the relative reduction of UDCA, orange ones of GUDCA, and grey ones of TUDCA. The boxes of the boxplots represent the interquartile range (IQR) and the line the median. Whiskers were limited to 1.5 times the IQR. The cross represents the mean

