Fig. 2.
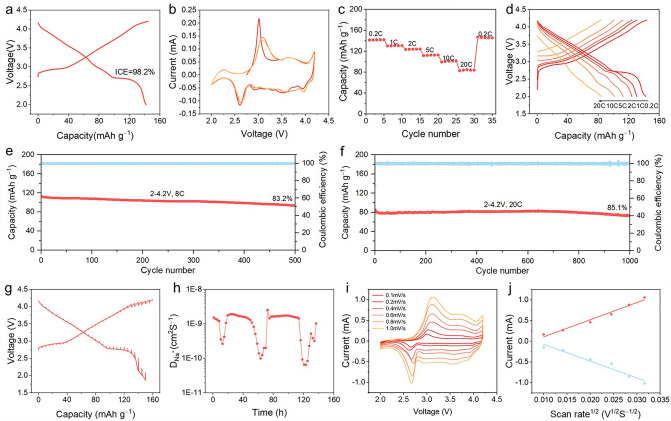
Electrochemical performance of Na0.95LNCFM cathode. a The initial charge − discharge curve at a 0.2C (1C = 200 mA g−1). b CV curves of the electrode scanned with 0.1 mV s−1. c Charge/discharge profiles at various rates. d Charge − discharge curves at various rates. e, f Long-term cycling performance at 8C rate and at 20C rate. g GITT curves. h The corresponding DNa+ calculated by GITT. i CV curves at different scan rates. j Liner relationship of peak currents with the scanning rate

