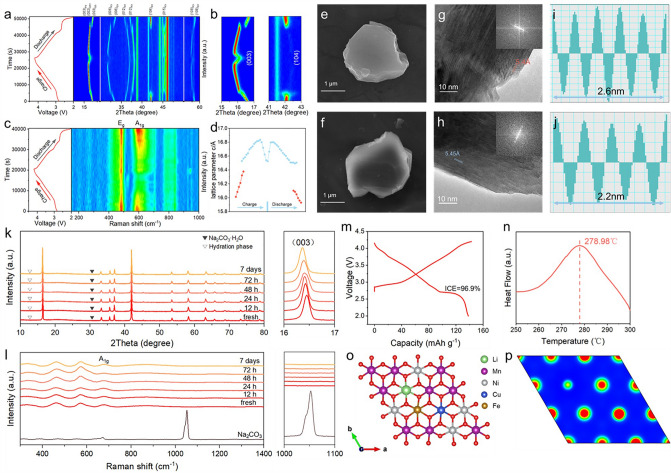
Fig. 3.
a In situ XRD patterns of Na0.95LNCFM during the first charge–discharge cycle at 20 mA g−1 between 2.0 and 4.2 V. b Contour map of in situ XRD patterns between 15°–17° and 41°–43°. c In suit Raman spectrum of Na0.95LNCFM during the first charge–discharge cycle at 25 mA g−1 between 2.0 and 4.2 V. d The lattice parameter c along with Na extraction/insertion for Na0.95LNCFM. e SEM image of Na0.95LNCFM before cycle. f SEM image of Na0.95LNCFM after 50 cycles. g The HRTEM image of Na0.95LNCFM. h The HRTEM image of Na0.95LNCFM after 50 cycles. i Intensity profile corresponding to g. j Intensity profile corresponding to h. k The XRD patterns of initial and exposed Na0.95LNCFM and corresponding magnified region of 16°–17° on the right. l The Raman spectrum of pristine and exposed Na0.95LNCFM corresponding magnified region of 1000–1100 cm−1 on the right. m The initial charge − discharge curve at a 0.2C after 48 h exposure. n DSC profiles of Na0.95LNCFM cathode charged to 4.2 V. o Schematic structures of Na0.95LNCFM. p Contour maps of charge density on corresponding planes in Na0.95LNCFM

