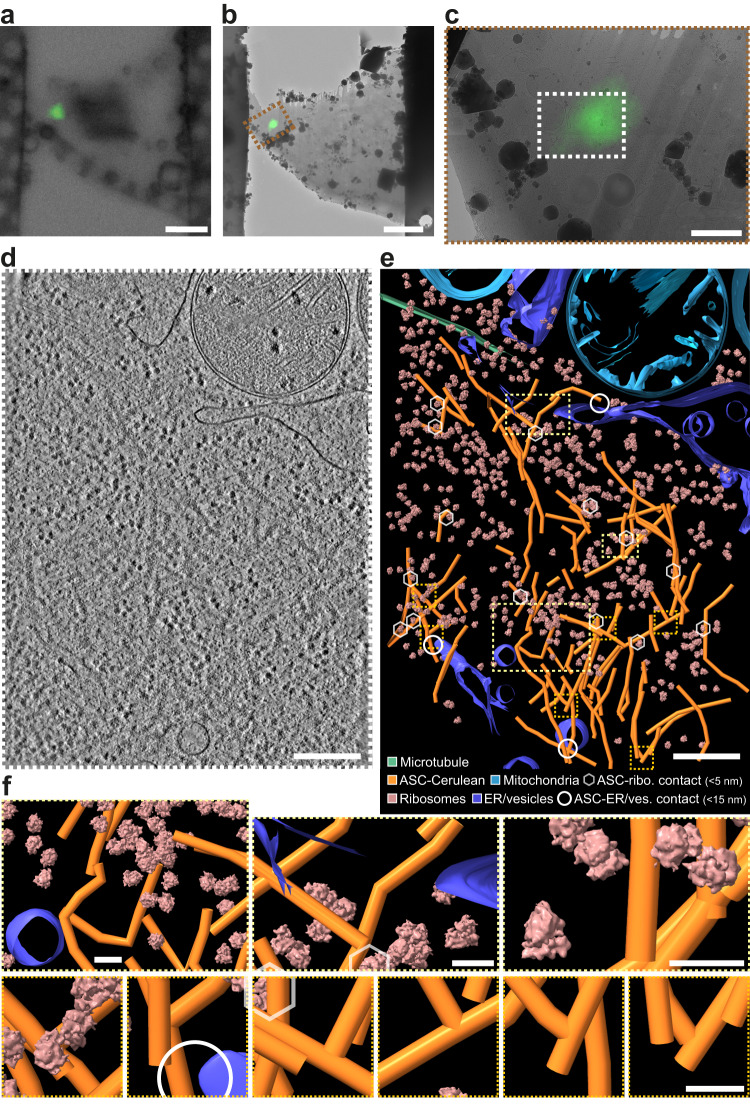
Fig. 1. Cryo-ET image reconstructions and models of ASC-caspase 1 puncta in iBMDMs.
a Cryo-FM image of a lamella from an iBMDM expressing ASC-mCerulean. ASC-mCerulean fluorescence is shown (green), overlaid on a bright-field image. Representative image of four biological replicates. Scale bar, 5 µm. b Cryo-FM image shown in (a) correlated with and overlaid on a cryo-EM map of the lamella with eC-CLEM ICY37. Representative image of four biological replicates. Scale bar, 5 µm. c Closeup of the area boxed in red in (b). Scale bar, 1 µm. d Reconstructed cryo-ET volume (13.6-nm thick virtual tomographic slice) of the area boxed in white in (c). Scale bar, 250 nm. e 3-D segmented model of an 1873 × 1386 × 108 nm volume covering the area shown in (d), generated with IMOD40. Scale bar, 250 nm. Hexagons denote ASC-ribosome contacts (<5 nm). Circles denote ASC-ER/vesicle contacts (<15 nm). f Closeups of the boxed areas in (e): Yellow boxes, representative views at different magnifications. Orange boxes, ASC filament branch points. Scale bars, 40 nm. The ribosome structure shown is a 23-Å resolution subtomogram averaging reconstruction of 1058 ribosomes from five tomograms of ASC-mCerulean puncta (see Supplementary Fig. 2).

