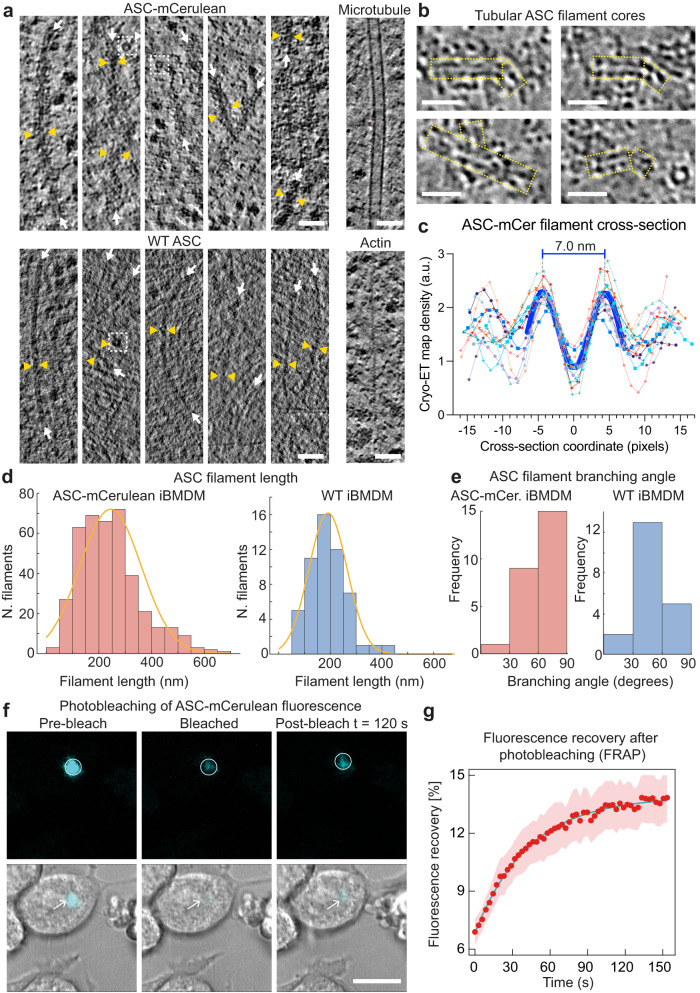
Fig. 2. Ultrastructure and dynamics of the ASC filament network in puncta in iBMDMs.
a Filaments in ASC-mCerulean puncta (upper left), or FAM-FLICA-labeled caspase-1 puncta, (lower left), in 4-nm thick virtual tomographic slices. White arrows indicate filament axes. Pairs of yellow triangles show filament thickness. Dashed white boxes highlight ring-shaped densities. Microtubules and actin filaments from the ASC-mCerulean tomogram are shown for reference. Scale bars, 50 nm. b Tubular filament cores (boxed in yellow) in representative 8-Å thick virtual tomographic slices after image restoration with cryoCARE42. Scale bars, 25 nm. c Cryo-ET density profiles from 13 ASC filament cross-section areas in 8-Å tomographic slices. 1 pixel = 8 Å. See Supplementary Fig. 4 for details on how density profiles were plotted. d Filament length distribution in ASC-mCerulean iBMDMs (left) and WT iBMDMs labeled with FAM-FLICA (right). e Distribution of branching angles in ASC-mCerulean puncta (from 2 tomograms), and a WT ASC punctum (1 tomogram). f Fluorescence recovery after photobleaching (FRAP) of ASC-mCerulean. Scale bar, 10 µm. Two independent experiments were performed. A total of eight cells were imaged for puncta formation and FRAP. g FRAP curve used to calculate the ASC-mCerulean dissociation rate (koff) from the bleached area. Shaded area represents ± s.e.m. for eight imaged cells (n = 8). See Source Data File for source data.

