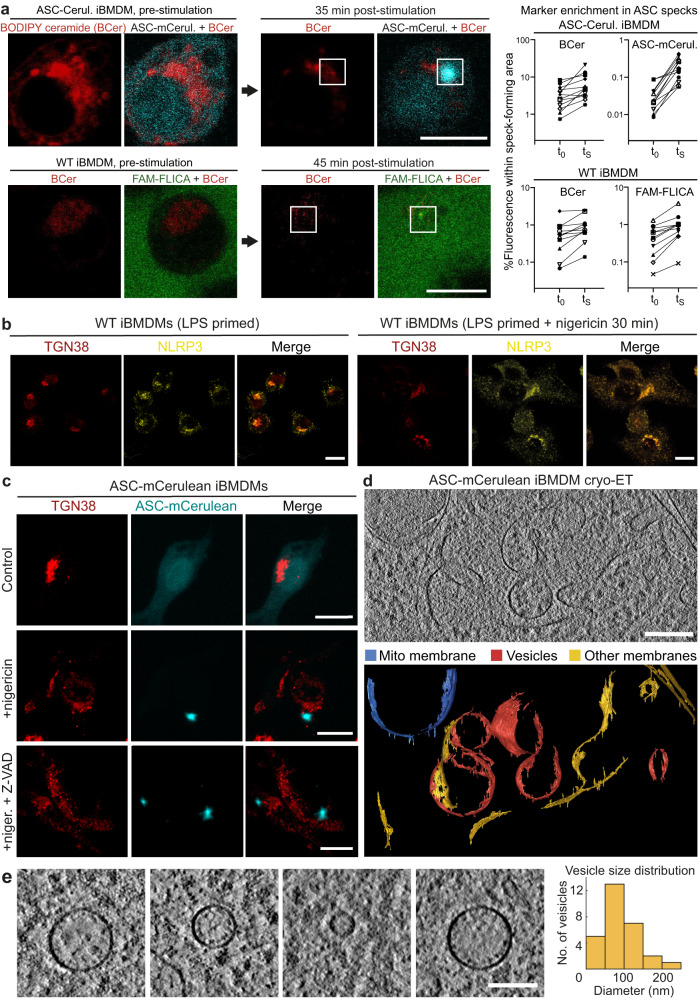
Fig. 3. Localization of vesicles with accumulated ceramides in ASC specks by live-cell fluorescence confocal microscopy and cryo-ET.
a Distribution of BODIPY TR ceramide (BCer) during ASC speck formation in iBMDMs expressing ASC-mCerulean, or WT iBMDMs stained with FAM-FLICA. Areas of speck formation are boxed. See Supplementary Movie 3 for full time courses. Right, percentage of whole-cell fluorescence that mapped to the area of speck formation, before and after speck formation, t0 and tS (1–3 min and 20–50 min after nigericin addition), respectively. 12 specks from ASC-mCerulean iBMDMs and 11 specks from WT iBMDMs were analyzed. See Source Data File for source data. Scale bars, 10 µm. b Immunofluorescence microscopy of LPS-primed WT iBMDMs with or without nigericin stimulation. Anti-NLRP3 partially colocalized with anti-TGN38. The TGN was dispersed following stimulation. Scale bar, 10 µm. See Supplementary Movie 4 for a Z-stack series. The images are representative of three independent experiments, with at least 20 cells imaged per experiment. c Immunofluorescence microscopy of LPS-primed ASC-mCerulean iBMDMs with or without nigericin stimulation, and with nigericin stimulation and caspase inhibitor Z-VAD-FMK. There is little overlap between ASC-mCerulean and anti-TGN38 fluorescence. Scale bars, 10 µm. The images are representative of three independent experiments, with at least 20 cells imaged per experiment. d 1.36-nm thick virtual tomographic slice within an ASC speck. Scale bar, 200 nm. Lower panel, 3-D segmentation model. e Vesicles from cryo-ET reconstructions of ASC-mCerulean iBMDMs. Scale bar, 100 nm. The histogram shows the vesicle size distribution.

