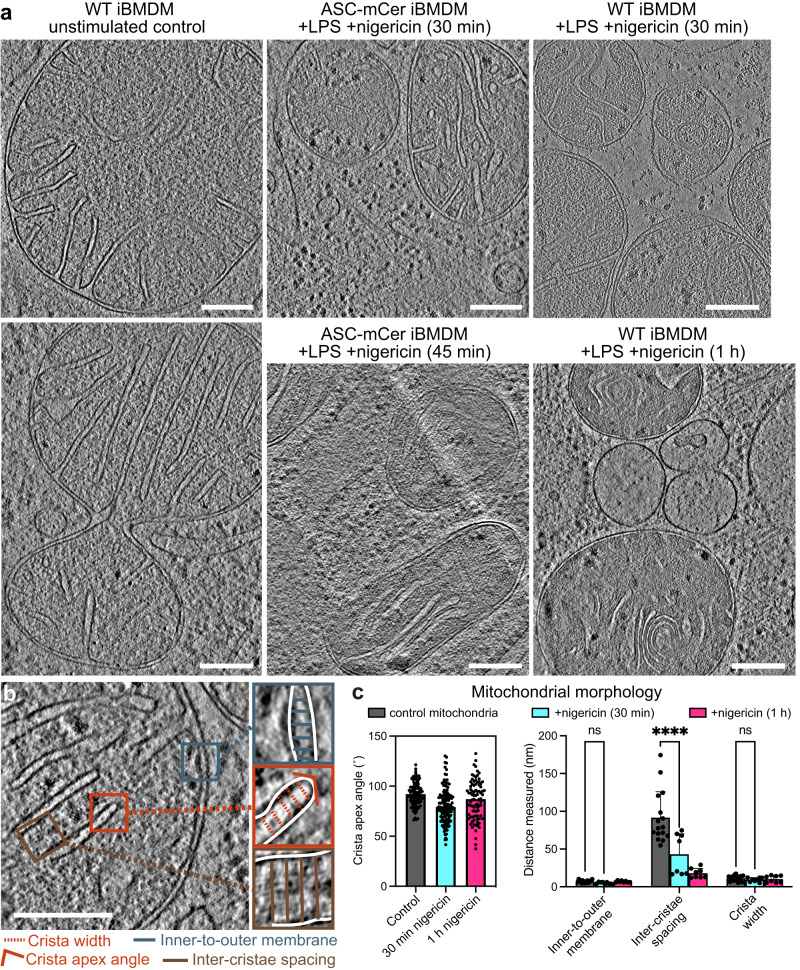
Fig. 4. Mitochondrial morphology before and after NLRP3 activation.
a Reconstructed cryo-ET tomographic slices of iBMDMs expressing WT or mCerulean-labeled ASC at different timepoints after stimulation with nigericin. See Supplementary Fig. 7 for additional examples including from THP-1 cells. Scale bars, 200 nm. b Cryo-ET reconstruction of a mitochondrion in an unstimulated WT iBMDM with closeup panels defining the following morphological parameters: inner-to-outer membrane spacing, inter-cristae spacing, crista width and crista apex angle. Scale bar, 200 nm. c Quantitative analysis of the morphological parameters defined in (b) in segmentation models of the mitochondrial membranes, as shown in (a). Parameters were measured in four tomograms for the control and two tomograms for each of the nigericin-stimulated samples. Error bars represent standard deviation from the mean. For the crista apex angles: “control”, n = 327; “30 min”, n = 187; “1 h”, n = 96. For other parameters: “control”, n = 16; “30 min”, n = 8; “1 h”, n = 8. Statistical test: two-way ANOVA, P = 10−4 (****). See Source Data File for source data.

