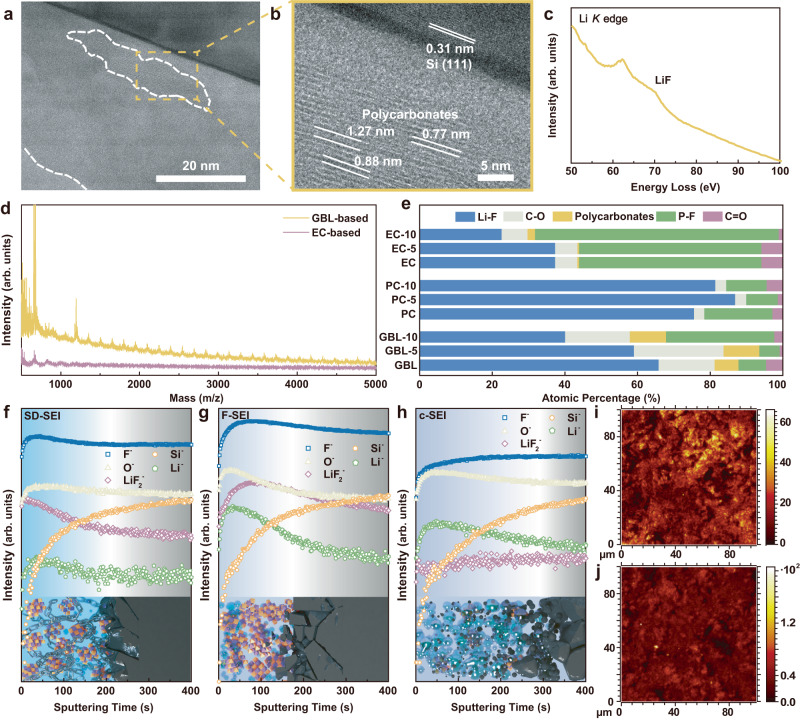
Fig. 2. SEI chemical composition.
a, b Cryo-TEM image and magnified image of SD-SEI. c Typical Li K-edge EEL spectrum of SD-SEI. d MALDI-ToF-MS of SD-SEI and c-SEI. e Relative content of selected components in the various SEI at different depths. The numbers closed to the ordinate represent the etching time (min). f–j Depth profiles of various secondary ion species obtained by sputtering in GBL-based electrolyte (f), PC-based electrolyte (g) and EC-based electrolyte (h), as well as ToF-SIMS secondary ion images of the cycled micron-sized Si electrodes of LiF2− (i) and O− (j) in GBL-based electrolyte. Source data in c–h are provided as a Source data file.

