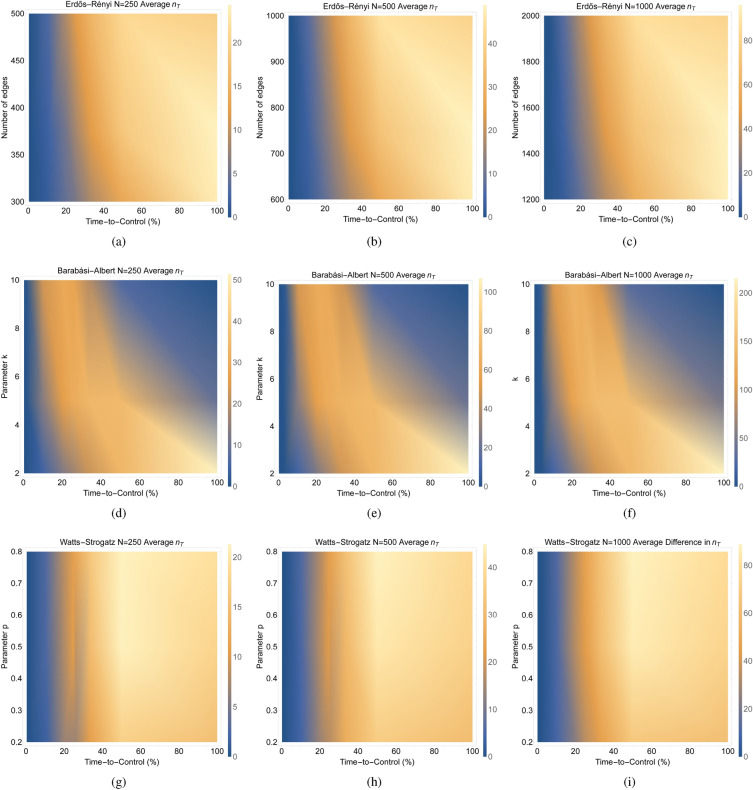
Figure 4.
These figures plot the average difference (over 100 networks) in the required number of driven nodes () across the time-to-control () for different types of random networks having different sizes and parameter values. For network sizes 250, 500, and 1000, respectively, (a–c) show average difference in the required number of driven nodes () across the number of edges in the network versus the time-to-control (%) for 100 realizations of Erdős–Rényi networks. For network sizes 250, 500, and 1000, respectively, (d–f) show the average difference in the required number of driven nodes () across the k parameter versus the time-to-control (%) for 100 realizations of Barabási–Albert networks. For network sizes 250, 500, and 1000, respectively, (g–i) show the average difference in the required number of driven nodes () across the p parameter versus the time-to-control (%) for 100 realizations of Watts-Strogatz networks.

