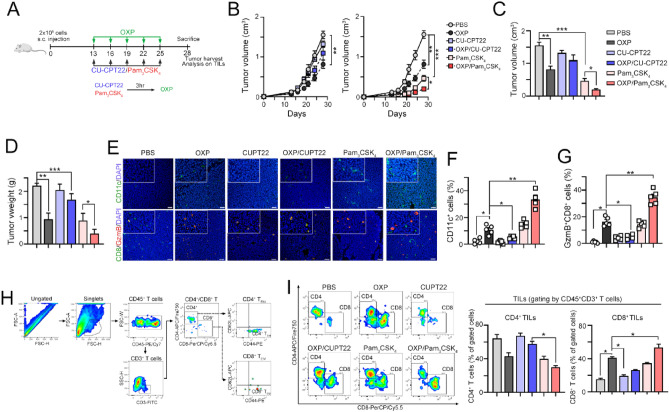
Figure 3.
Systemic inhibition of TLR1/2 signaling reduced the therapeutic efficacy of chemotherapy in vivo. (A) Diagram of the animal experiment. (B) CT26 cells were subcutaneously inoculated into BALB/c mice for 13 days as the tumor volume reached 100 mm3. After randomization into 6 groups, OXP (6 mg/kg/mouse, i.p.) was administered on Days 13, 16, 19, 22 and 25. The TLR1/2 antagonist CU-CPT22 (2.5 mg/kg/mouse) and TLR1/2 agonist Pam3CSK4 (2.5 mg/kg/mouse) were administered 3 h before OXP administration. Tumor volume was measured every 3 days (n = 5–6). Two-way ANOVA t test, *p < 0.05, **p < 0.01 and ***p < 0.001. (C) The tumor volume was recorded on the end-point day (Day 28, n = 5–6). One-way ANOVA t test, *p < 0.05, **p < 0.01 and ***p < 0.001. (D) The resected tumor weight was recorded (n = 5–6). One-way ANOVA t test, *p < 0.05, **p < 0.01 and ***p < 0.001. (E) The densities of CD11c+ DCs and CD8+ T cells in resected tumors were analyzed by immunohistochemistry (n = 3–4). (F) The quantification of CD11c+ DCs in resected tumors is shown (n = 5). One-way ANOVA t test, *p < 0.05 and **p < 0.01. (G) The quantification of GzmB+CD8+ T cells in resected tumors is shown (n = 5). One-way ANOVA t test, *p < 0.05 and **p < 0.01. (H) Gating strategy of the tumor-infiltrating immune cell profile. (I) The phenotype of CD3+CD45+ tumor-infiltrating immune cells was analyzed by flow cytometry (n = 4–5). The percentage of CD4+ T cells (CD4+CD3+CD45+ T cells) and CD8+ T cells (CD8+CD3+CD45+ T cells) in total T cells (CD3+CD45+ T cells) was examined. One-way ANOVA t test, *p < 0.05.

