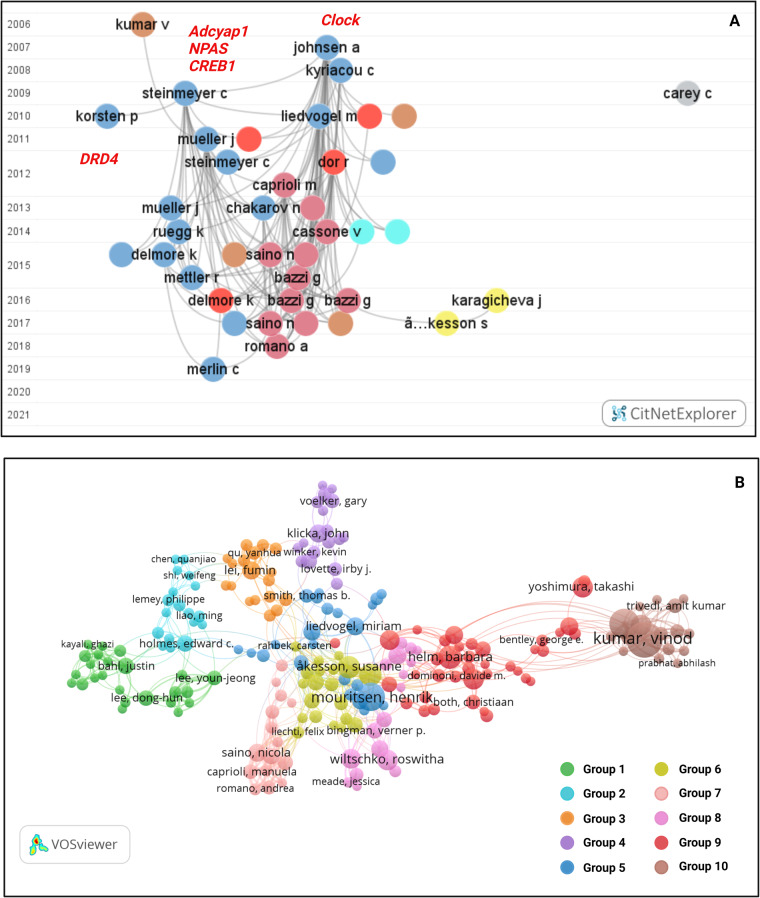
Fig. 2.
Visualised citation network for studies identified in literature searches. (A) Citation network of the Scopus and PubMed database in CitNetExplorer. Publications are organized by year (2006–2021) with the name and first initial of the first author indicating individual studies. The relationship between studies by virtue of co-citations in the reference lists are indicated by grey lines. Subgroup analyses identified several key groups, indicated by the colour code from VOSviewer. Key candidate genes are indicated in red italics and show studies that assayed polymorphisms in the Clock, Adcyap1, CREB1, NPAS, and DRD4 genes. (B) Citation network for studies identified in literature searches of the Dimensions and ScienceDirect database in VOSviewer. First authors are labelled by surname and first name. Automated group analyses identified ten clusters of related studies of which the studies identified from Scopus formed part of five groups, indicated as groups 2, 5, 6, 7, 9, and 10. This network shows the larger field of migration studies including non-candidate gene studies such as transcriptomic studies (group 10). (image edited in BioRender.com).

