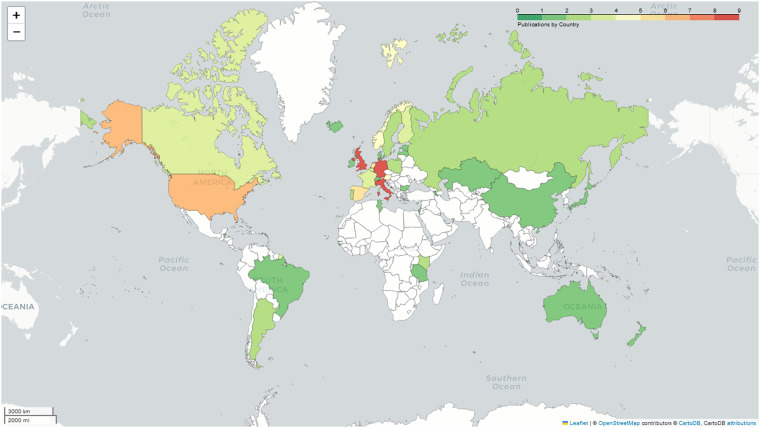
Fig. 4.
Geographic distribution of candidate gene studies included in the final review dataset (N = 34) based on sampling locations. Related migration studies (N = 32), such as transcriptomic or epigenetic studies, were excluded. The density gradient plots the number of studies per country ranging from one study (green) to more than eight studies (red); countries in white are data deficient. The overall plot indicates that most studies emanated from sampling locations in Europe and North America, with only a small number of studies including sampling from parts of Africa and South America.

