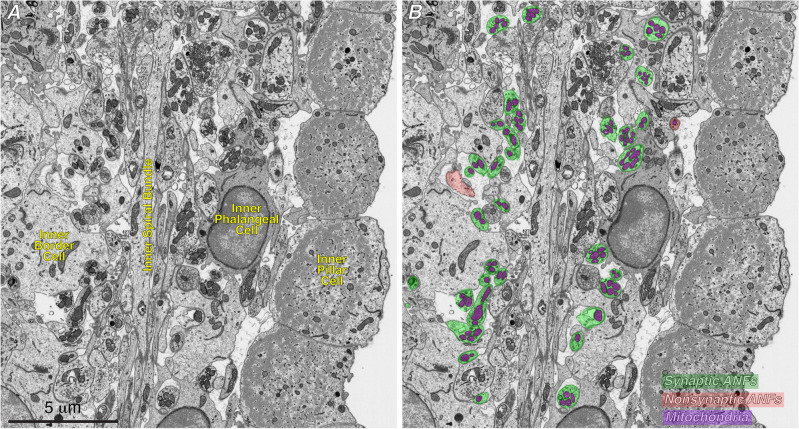
Figure 2.
We used machine learning to automate much of the ultrastructural analysis. (A) Representative low-power micrograph of one slice of a control FIB-SEM stack from the region below the IHCs. (B) The same slice as in (A), with masks superimposed on all the mitochondria within ANFs, as found by the auto-segmentation routine, as well as masks superimposed on all the afferent fibers, color coded as to whether or not they ultimately formed a synapse with the IHC.

