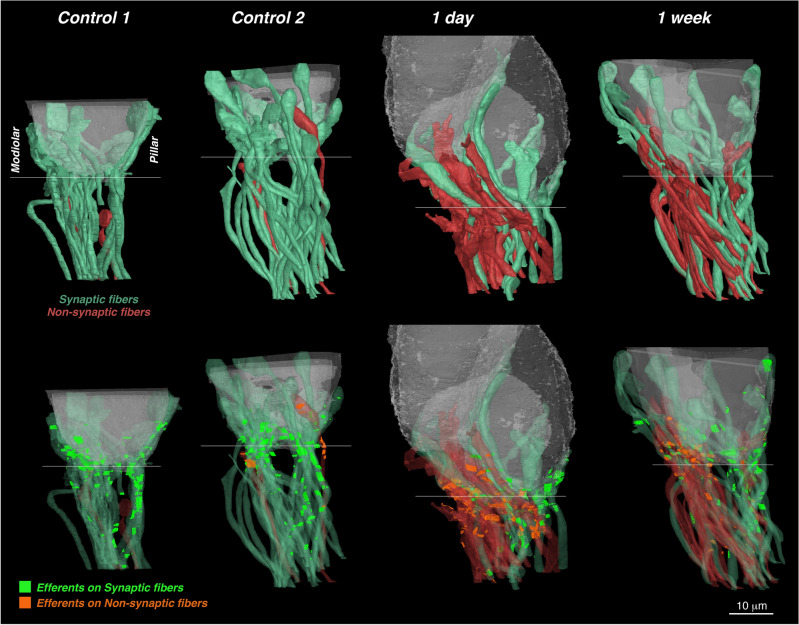
Figure 6.
Semi-transparent 3D renderings of the IHCs, ANFs and efferent synapses for the four FIB-SEM stacks, each oriented with the modiolar faces of the IHCs to the left and the pillar faces to the right. The top row of images emphasizes the differences between ANFs making synaptic contacts (green) vs. those not (red). The bottom row shows the locations of the efferent contacts, colorized according to which type of ANF they synapse with. To generate the efferent plaque images, a line (1 voxel thick) was traced along the apposing membranes of the ANF and the efferent in each of the serial sections where there were synaptic specializations (see Fig. 9). Scale bar applies to all images. Thin white line on each reconstruction indicates the approximate location of the bottom of the IHCs and is roughly parallel to the sectioning plane.

