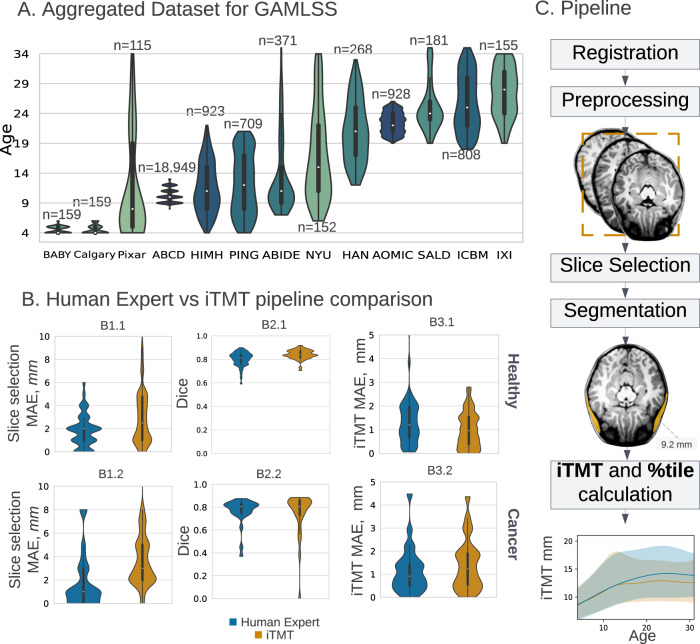
Fig. 1. Dataset summary and method overview.
A Aggregated dataset from 13 primary studies (total N = 23876 T1w MRI, see Supplementary Methods A7) with violin plot age distributions with annotated dataset size. Violin plots show the kernel density estimation of the distribution, with a boxplot overlay, with the median marked by a white dot, the interquartile range marked by the thick black bar, and the range by the thin black line. The darker color corresponds to the bigger dataset size. B iTMT performance compared to interobserver variability of Human Expert. The top panel: healthy, and the bottom: the Brain tumor cohort. Panel B1-Slice Selection MAE in mm (Human Expert for Healthy cohort (n = 46) MAE = 2.0 mm [IQR = 1.−2mm], iTMT MAE = 2.5 mm [IQR = 1–4.75 mm]; Human Expert for Brain tumor cohort (n = 25) Slice Selection MAE = 1.0 mm [IQR = 0–3 mm], iTMT MAE = 3.0 mm [IQR = 2–5 mm]). Panel B2-Dice (Human Expert for Healthy cohort Dice = 0.81 [IQR = 0.76–0.84], iTMT Dice = 0.84 [IQR = 0.81–0.87]; Human Expert for Brain tumor cohort Dice = 0.81 [IQR = 0.75-0.83], iTMT Dice = 0.81[IQR = 0.73–0.86]). Panel B3-iTMT MAE in mm (Human Expert for Healthy cohort MAE = 1.20 mm [IQR = 0.66–1.96 mm], iTMT MAE = 0.96 mm [IQR = 0.4–1.53 mm]; Human Expert for Brain tumor cohort MAE = 0.92 mm [IQR = 0.5–1.4 mm], iTMT MAE = 1.23 mm [IQR = 0.55–1.9 mm]). TMT temporalis muscle thickness, MAE median absolute error, GAMLSS Generalized Additive Models for Location Scale and Shape. P-values were tested using the Mann–Whitney two-sided U test. Violin plots show the kernel density estimation of the distribution, with a boxplot overlay, with the median marked by a white dot, the interquartile range marked by the thick black bar, and the range by the thin black line. C Method overview. Step 1: Registration to age-specific MNI (Montreal Neurological Institute) template and manual check. Step 2: MRI T1w preprocessing: rescaling, z-normalization. Step 3: Slice selection via Dense Net model. Step 4: Segmentation via UNet prediction. Step 5: iTMT calculation using GAMLSS growth charts(error bands CI 2.5–97.5%). For more details on each step, please refer to the Methodology section. Source data are provided as a Source Data file.

