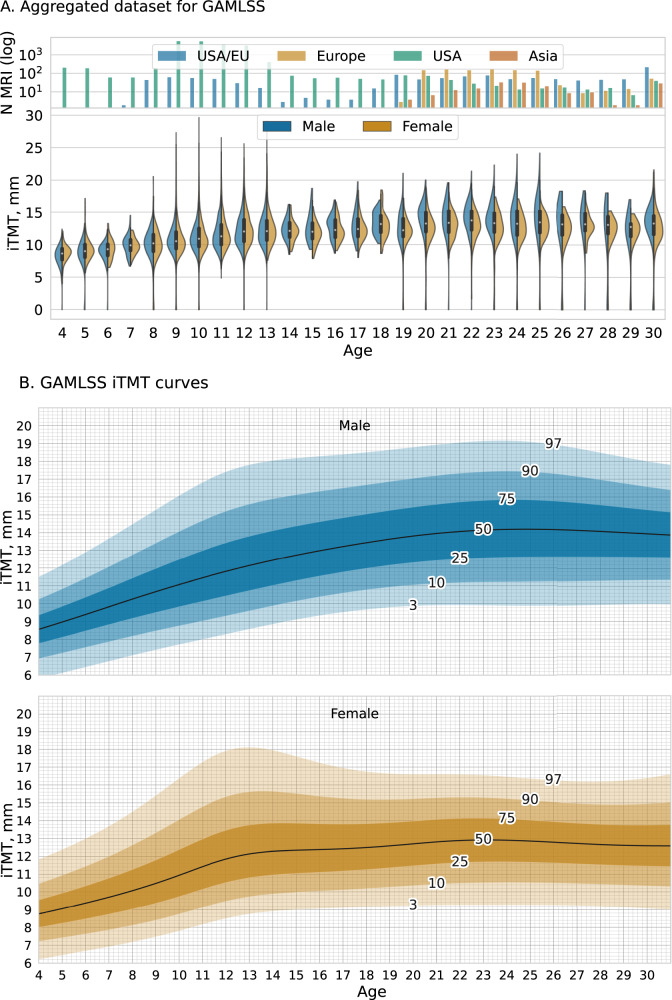
Fig. 3. Temporalis Muscle Normal Reference Growth Charts.
A Sex-specific iTMT by age for the healthy cohort N = 23,876. Top panel: count plot demonstrates the geographical location of primary studies (scaled log Y-axis). Bottom panel: violin plot, raw predicted iTMT ranges split by biological sex. Violin plots show the kernel density estimation of the distribution, with a boxplot overlay, with the median marked by a white dot, the interquartile range marked by the thick black bar, and the range by the thin black line. The age group 30–35 was collapsed into one category 30+, due to the sparsity of the data available. The correlation between data size and the frequency of outliers (>3 standard deviations) is positive, indicating that larger datasets tend to have a greater number of outliers (The biggest open source dataset ABCD30 (N = 18,949 T1w MRIs) for the age group 8–13). See Supplementary Information A7 for details on demographics data. The mixed origins dataset was labeled as EU/USA. B iTMT normal reference growth charts with percentile lines for females (bottom) and males (top). We developed these charts by applying iTMT to 23,876 T1w MRI scans for patients aged 4–35 and creating growth centile curves estimated using GAMLSS. The age group 30–35 was collapsed into one category 30+ for curve stability. See Supplementary Figs. S23–S24 for CSA and iTMT Growth charts. GAMLSS Generalized Additive Models for Location Scale and Shape. Source data are provided as a Source Data file.

