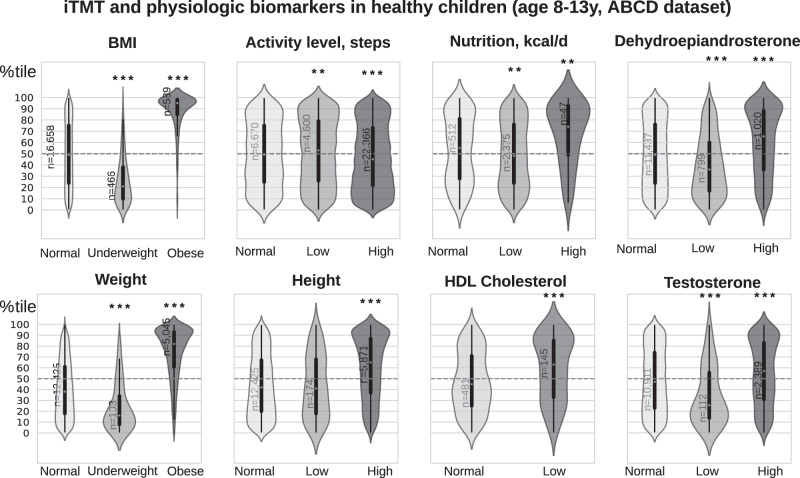
Fig. 4.
The association between iTMT centile scores and patients’ BMI 77, height/weight77, activity levels78, nutrition79, dehydroepiandrosterone(DHEA)80, cholesterol81, and testosterone82 for patients aged 8–13 (Source: ABCD30). Violin plots show the kernel density estimation of the distribution, with a boxplot overlay, with the median marked by a white dot, the interquartile range marked by the thick black bar, and the range by the thin black line. Statistically significant groups (*P < 0.05, **P < 0.01, ***P < 0.001) that are labeled with an asterisk (*) were tested with two-sided Mann–Whitney U-test. For age- and sex-specific definitions of normal/high/low ranges for physical biomarkers, refer to Supplementary Methods A8. Source data are provided as a Source Data file.

