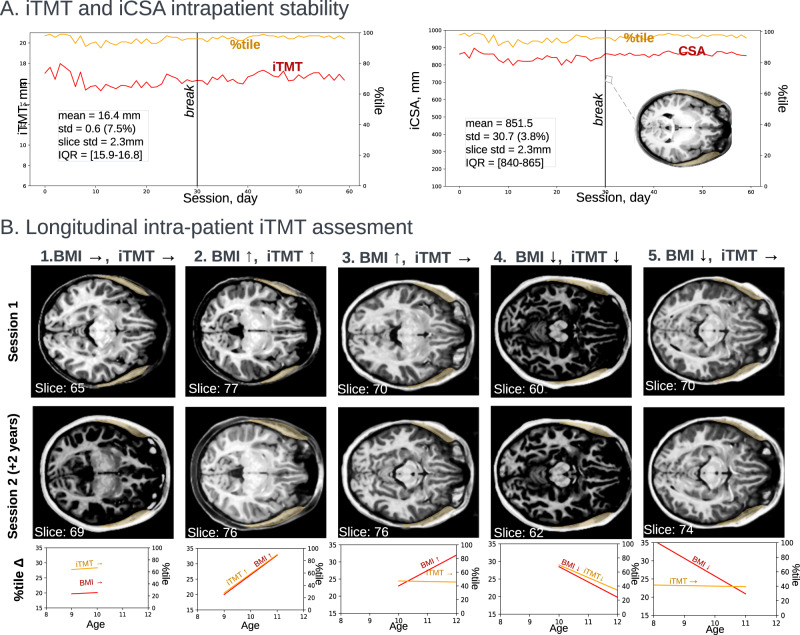
Fig. 6. Longitudinal intra-patient iTMT assessment.
A The participant (Female, 23 y.o.) underwent daily testing for two studies of 30 consecutive days with one year in between47. Left: iTMT and centile measurement computed for daily T1w scans; right: CSA and centile scores with an overlay of predicted iTMT mask T1w MRI taken on the 30th day. The mean iTMT for 1st session (duration of 30 days) was 16.3 mm ± 0.71 mm; the mean iTMT for both studies was 16.4 mm ± 0.6 mm. The mean slice selection error is 2.7 mm. B Feasibility of tracking intra-patient changes (dataset: ABCD30). On the top right of each MRI, the age and biological sex is displayed, and on the bottom left information about the predicted slice by the first stage. (1) BMI stable, TMT stable; (2) BMI increased, TMT increased; (3) BMI increased, TMT stable, (4) BMI increased, TMT decreased; (5) BMI decreased, TMT stable. BMI body mass index, TMT temporalis muscle thickness. Source data are provided as a Source Data file.

