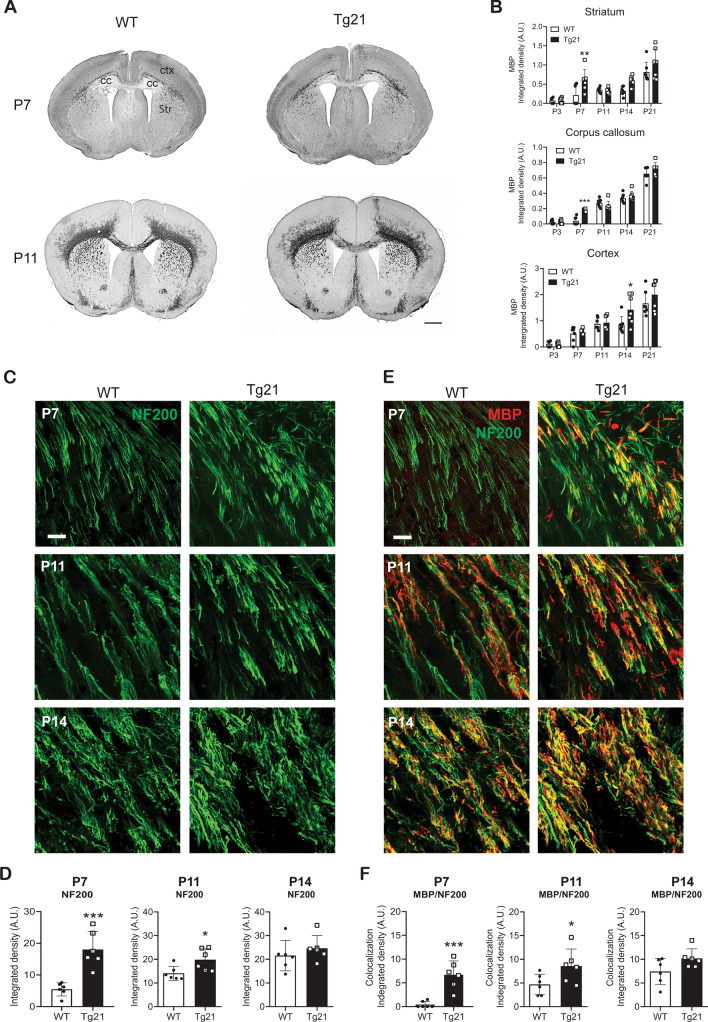
Figure 2.
Earlier onset of myelination in Tg21 mice. (A) Representative coronal images of MBP staining at P7 and P11 show an increase in myelination with age and stronger staining in the Tg21 striatum and corpus callosum at P7. WT P7 image shows the areas of myelination analysis: ctx = cortex; cc = corpus callosum and Str = striatum. Scale bar: 1 mm. (B) Densitometric analysis of MBP expression in the striatum, corpus callosum, and cortex across postnatal ages P3, P7, P11, P14 and P21. Data are given as mean ± SD, N = 7 animals per age and genotype. Striatum: 2-way ANOVA, F(1,60) = 11.42, P = 0.0013. Multiple comparisons: **P = 0.0033. Corpus callosum: 2-way ANOVA, F(1,60) = 5.599, P = 0.0025. Multiple comparisons: ***P = 0.0004. Cortex: 2-way ANOVA, F(1,60) = 2.64, P = 0.0085. Multiple comparisons: *P = 0.013. (C) Representative fluorescent confocal images of the axonal marker heavy neurofilament (NF200, green) in the striatum of WT and Tg21 mice at postnatal ages P7, P11, and P14. Scale bar: 20 μm. (D) Integrated density of NF200 immunoreactivity in WT and Tg21 mice. P7, unpaired t-test, ***P = 0.0005. P11, unpaired t-test, *P = 0.027. P14, unpaired t-test, P = 0.39. N = 6 animals per age and genotype. (E) Representative fluorescent confocal images of myelin (MBP, red) and the axonal marker heavy neurofilament (NF200, green) in the striatum of WT and Tg21 mice at postnatal ages P7, P11, and P14. A higher myelination ratio observed by co-localization (yellow), occurs in the Tg21 striatum at P7 and P11. Scale bar: 20 μm. (F) Myelination axonal coverage (MBP/NF200) in WT and Tg21 mice. P7, unpaired t-test, ***P = 0.0005. P11, unpaired t-test, *P = 0.041. P14, unpaired t-test, P = 0.179, N = 6 animals per age and genotype.

