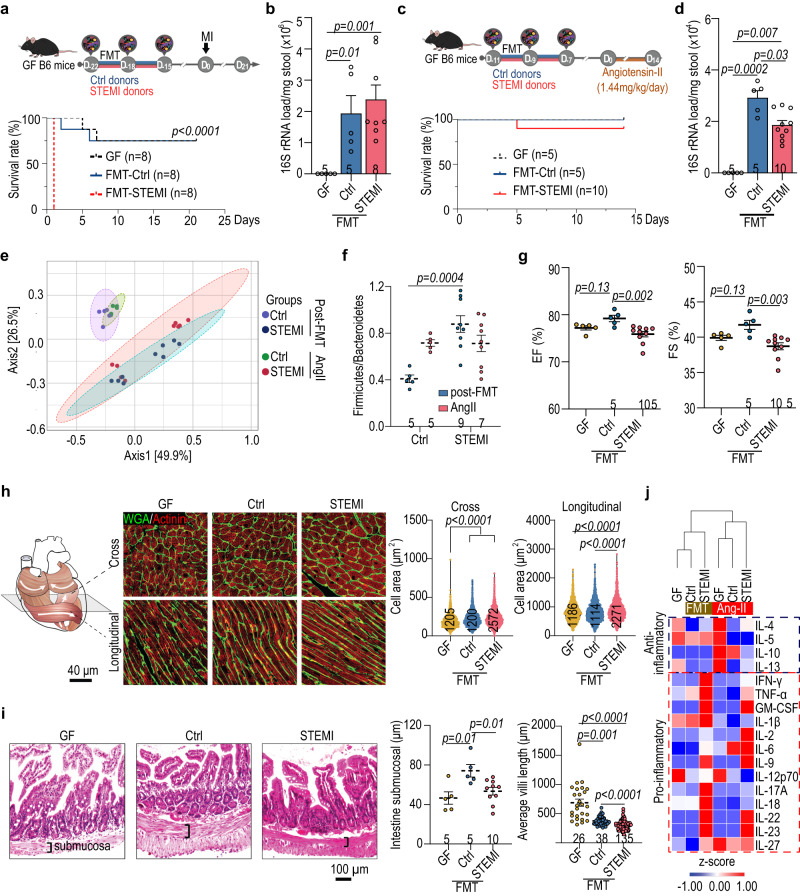
Fig. 3. STEMI fecal microbiota transplantation in germ-free mice deteriorates post-injury cardiac repair.
Twelve-week-old germ-free (GF) mice were colonized with human fecal microbiota for 7 days before cardiac injury. a Experimental design for myocardial infarction (MI) model on fecal microbiota transplantation (FMT)-GF mice (upper panel). The survival rate of FMT-GF mice subjected to MI for 21 days (lower panel). Data were analyzed with log rank (Mantel–Cox) test with 95% confidence interval. b qPCR-based determination of fecal bacterial load for the FMT-GF mice subjected to MI (vs. Ctrl). c Experimental design for angiotensin II (AngII) challenge on FMT-GF mice (upper panel). The survival curve of FMT-GF mice subjected to AngII challenge for 14 days (lower panel). d The fecal bacterial load for the FMT-GF mice administrated with AngII. e Differential grouping of the gut microbiota in Ctrl and STEMI samples in unweighted principal co-ordinates analysis (PCoA). f The ratio of gut Firmicutes relative to Bacteroidetes in FMT mice after cardiac injury. g Echocardiographic analysis of left ventricular ejection fraction (EF, %) and fraction shortening (FS, %) in FMT-GF mice on day 14 after AngII challenge. h Changes in the size of cardiomyocytes in FMT mice subjected to AngII challenge for 14 days. The illustration of muscle orientation in the heart (upper left) and the representative immunofluorescent staining of cardiac tissues with WGA-488 co-stained with actinin (upper right). The statistical analysis of cardiomyocyte size is shown in the lower panel with cell number listed in the inset of each bar. i The colonic pathophysiology of GF mice receiving control and STEMI-FMT were examined with hematoxylin and eosin staining. The statistical analysis of submucosal thickness and villi length of proximal colon is shown the right panel. j The changes of anti-inflammatory and pro-inflammatory cytokines in GF mice receiving control and STEM FMT, determined using multiplex immunoassays. The number of biologically independent mice are indicated in each chart. Kruskal–Wallis test followed by FDR correction was used to analyze data in (b, d, g–i) two-way ANOVA was used to analyze data in (f). Data are represented as mean ± SEM.

