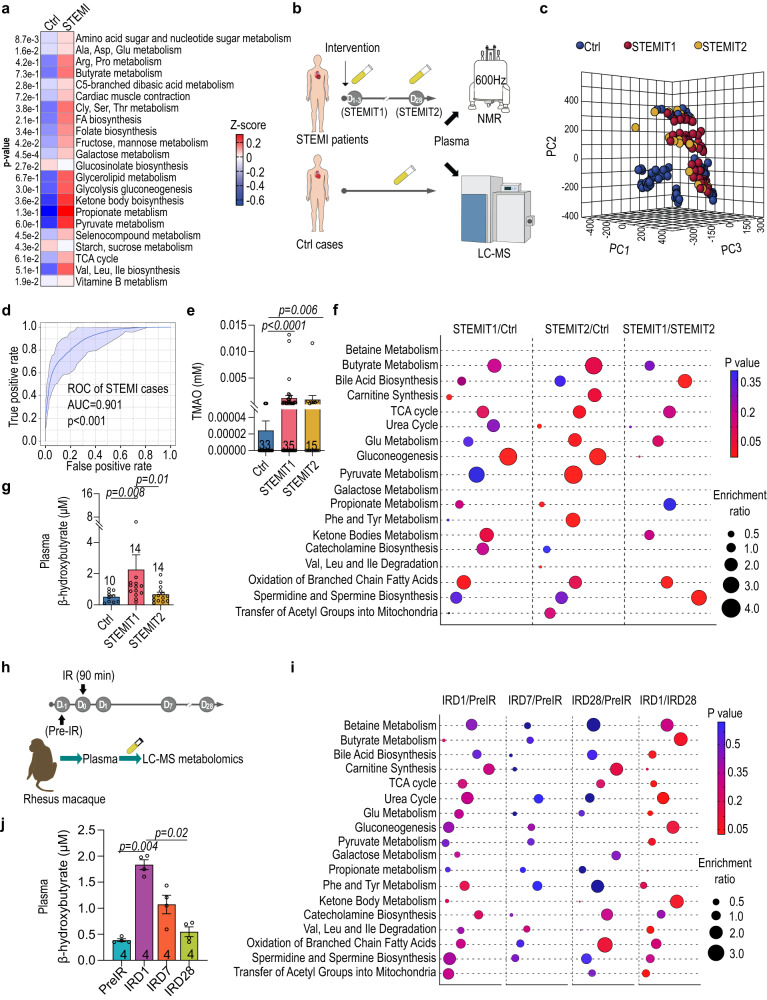
Fig. 4. Ketone body biosynthesis and degradation pathways are enriched in STEMI patients.
a Enrichment of metabolic pathways revealed by shotgun metagenomics with Ctrl and STEMIT1 samples. b Schematic illustration of human plasma metabolomics profiling using nuclear magnetic resonance (NMR) and liquid chromatography–mass spectrometry (LC-MS). c Partial Least Squares Discriminant Analysis (PLS-DA) of Ctrl, STEMIT1 and STEMIT2 based on NMR plasma metabolite profiling. d ROC curve for STEMI prediction based on the enrichment of lactate, pyruvate, acetone, acetoacetate, glutamate, 3-hydroxybutyrate and butyrate based on NMR plasma metabolite profiling. e The plasma level of Trimethylamine-N-oxide (TMAO) in human control and STEMI samples determined with NMR (vs. Ctrl). f Metabolic pathway enrichment in the Ctrl, STEMIT1 and STEMIT2 plasma samples via LC-MS analysis. The enrichment ratio was computed by observed hits/expected hits. g The level of human plasma β-hydroxybutyrate using colorimetric assay (vs. STEMIT1). h Nonhuman primates subjected to cardiac ischemic/reperfusion (IR) injury for ninety minutes and the plasma samples were collected at −1D (pre-IR), D1 (IRD1), D7 (IRD7) and D28 (IRD28) and subjected to LC-MS metabolomics profiling. i Enrichment of the metabolic pathways of rhesus macaque at pre-IR, IRD1, IRD7 and IRD28 using LC-MS. j The level of rhesus macaque plasma β-hydroxybutyrate using colorimetric assay (vs. IRD1). The number of biologically independent samples are indicated each chart. Data in a, f, i were analyzed with two-sided unpaired Student’s t-test, data e, g, j were analyzed with Kruskal–Wallis test followed by FDR correction. ROC curves were analyzed with Wilson/Brown test with 95% confidence interval. Data are represented as mean ± SEM.

