Fig. 1.
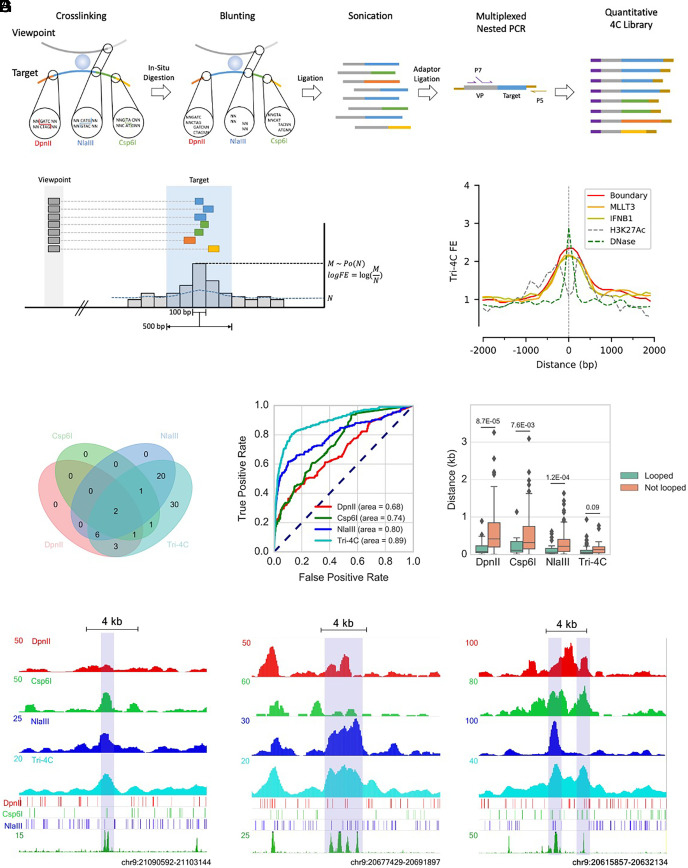
Tri-4C robustly and unbiasedly identifies CRLs. (A) Schematics of Tri-4C library construction. (B) Tri-4C loop calling algorithm. Each 100 bp sliding bin collects read count (M) from neighboring 500 bp intervals. Significant loops and their loop strengths are determined by Poisson statistics of M against expected read count N calculated from the total read counts in the 5 to 50 kb local background. (C) Center Plot of Tri-4C signals at all DHS-marked CREs in the 9p21 IFNB1 TAD. (D) Venn diagram of reproducible CRLs (N = 2) called for the Boundary viewpoint using Tri-4C and UMI-4C digested by three different REs (E) ROC analysis using loop signals [−log(p)] for each 100 bp bin steps from Boundary as predictors of intra-TAD DHS peaks. (F) Boxplot for distance between intra-TAD DHS peak (N = 85) center and the closest restriction site, separated by whether the peak is called to loop with any of the three viewpoints. (G) Correlation between raw signals of Tri-4C and UMI-4C and neighboring restriction site patterns at three CRE regions looped with Boundary. Statistic p values were calculated by the U test. The y axis of 4C methods denotes read count per 10,000 uniquely mapped reads.

