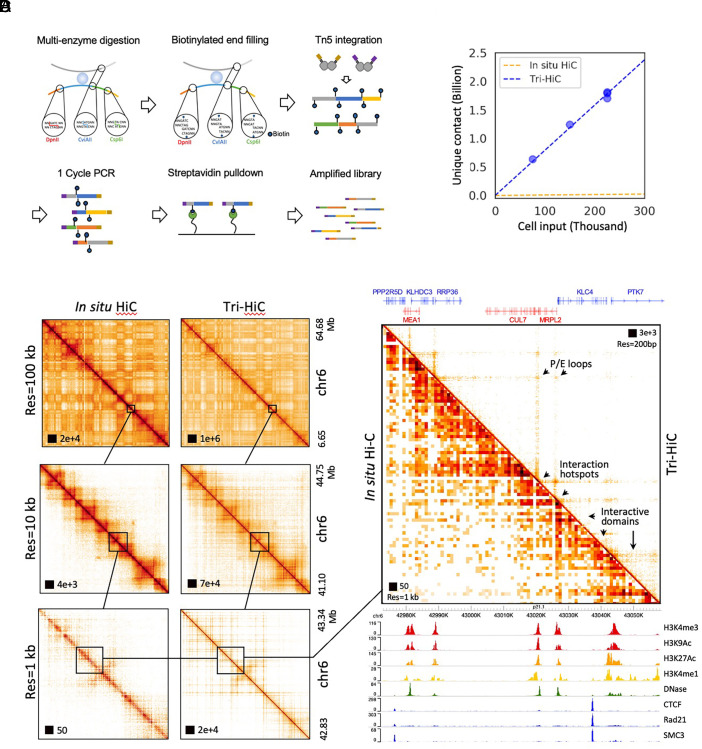
Fig. 2.
(A) Schematics of Tri-HiC library construction. (B) Yield curve of Tri-HiC (N = 5) in comparison with yield of in situ Hi-C for IMR90 (N = 7) reported by Rao et al. (3), assuming that each in situ Hi-C library was constructed with 2 million cells as minimum suggested by authors. (C) An example comparison of interaction maps of a locus on chromosome 6 between Tri-HiC and in situ Hi-C at multiple resolutions. (D) A 90 kb zoomed-in region from C with gene and epigenetic annotations. Arrows highlight microstructural features uniquely revealed by Tri-HiC, including interaction hotspots (anchors for nonspecific interaction stripes), promoter-enhancer (P/E) loops, and interaction microdomains.

